To quickly access the page content, please click on the links below:
News Update
- CARB Releases Proposed LCFS Amendments Ahead of March 21 Public Hearing. On December 19, California’s Air Resources Board (CARB) released a preliminary LCFS proposal laying out amendments which nearly mirrored those in the Standardized Regulatory Impact Assessment released in September. CARB proposed a 30% reduction in carbon intensity by 2030, including a 5% step-down in 2025. This marks a 50% increase in carbon targets over the original 20% reduction target for 2030. Reductions increase to 90% by 2045 compared to a 2010 baseline. The proposal contained an automatic acceleration mechanism (AAM) which would advance stringency for a given year when unused credits more than triple average deficit generation by advancing the carbon reduction target by two years. Amendments included eliminating the exemption for intrastate jet fuel beginning in 2028 and new tracking requirements for crop-based and forestry-based feedstocks to their point of origin. The regulator proposed phasing out biogas used in transportation fuel by 2041 and by 2045 for biomethane used to produce renewable hydrogen. CARB expects to kick off the required 45-day public comment period in January, with a public hearing set for March 21, 2024.
- Washington Aims for SAF Eligibility in Rulemaking Update. The Washington Department of Ecology will begin rulemaking early 2024 to advance SAF pathways for credit generation as early as December 31, 2023. Earlier this year, Washington legislators passed a law requiring the department to accept SAF applications by the end of 2023 and accepting biomethane as a feedstock for renewable diesel and SAF. The move builds on the state’s SAF credit eligible for SAF sold on flights departing the state. The $1/gallon base credit value can reach a maximum of $2/gallon based on each percentage point in carbon reduction under 50%. Next year’s round of rulemaking will seek to establish a third-party verification program, incentives to encourage SAF production, update book-and-claim accounting requirements for electricity and methane. Washington is not adjusting current annual targets, land-use change requirements and models that set fuel carbon intensity scores.
- British Columbia Low Carbon Fuel Standard to Require SAF. The government of British Columbia on December 11 released new rules for its Low Carbon Fuels Standard, set to take effect on January 1, 2024. Under the updated regulations, SAF must make up 1% of the fuel mix by 2028, rising to 2% for 2029 and 3% for 2030 and beyond. The regulations include carbon intensity reductions for jet fuel starting at 2% in 2026, 4% in 2029, 6% in 2028, 8% in 2029 and 10% for 2030 and beyond. CI reduction requirements for gasoline and diesel start at 16% in 2024, rising to 18.3% in 2025, 20.6% in 2026, 23% in 2027, 25.3% in 2028, 27.7% in 2029 and 30% in 2030.
- EIA Boosts 2023 Renewable Diesel Production & Consumption Estimates, 2024 Outlook Dims. The EIA projected 2023 renewable diesel production of 174,000 Bbl/d in its December Short-Term Energy Outlook, a 1.8% increase from November. The forecast for 2024 production was cut by 0.8% to 236,000 Bbl/d. Demand for 2023 was forecast 1,000 Bbl/d higher at 195,000 Bbl/d, while the 2024 demand outlook was cut by 2,000 Bbl/d to 260,000 Bbl/d. The December STEO showed 2023 net renewable diesel imports unchanged at 23,000 Bbl/d for 2023 and 24,000 Bbl/d for 2023.
- Marathon Martinez Refinery Fires Trigger Federal Investigation. Recent fires at Marathon’s Martinez refinery triggered a federal investigation by the Chemical Safety and Hazard Investigation Board (CSB). Fires on November 11 and November 19 at a hydrodeoxygenation (HDO) unit led to spills of RD. Marathon aims to achieve 48,000 Bbl/d of production at its Martinez, California facility by year-end.
- Treasury Department Issues SAF Guidance. The US Treasury Department issued guidance on December 15, 2023, clarifying how SAF will be eligible for tax credits worth as much as $1.75/gallon under the Inflation Reduction Act. The SAF tax credit is only issued to fuels which reduce lifecycle GHG emissions 50% below petroleum-derived jet fuel. The Treasury Department plans to calculate emissions intensity using a modified version of the GREEET model planned for March 1, 2024. The adjusted GREET model could open the door for corn-based ethanol to contribute to SAF supply.
- The Washington Clean Fuel Standard Posts Net Credit Surplus for the First Quarter. A total of 275,442 credits were generated, with ethanol accounting for 64% of the total and renewable diesel making up 12%, according to the state’s inaugural quarterly report. Deficits came in at 227,768, for a quarterly surplus of 47,674 credits. The market reacted bearishly with prompt credits tumbling to $79/t from $101/t, or 22%, over the span of just a week.
- Canadian Fuel Regulation Credits Trade. Canadian regulator Environment and Climate Change Canada (ECCC) announced the first trades for the program in early July without releasing volumes or pricing. Credits generated in 2022 and 2023 became eligible for trade on June 30th, 2023. The Clean Fuel Regulations (CFR) target a 30% reduction in transport fuel carbon intensity by 2030. AEGIS saw CFR credits bid at C$205/t for 2023 transfer on July 12, 2023.
- PG&E Lowers Auction Volume for First Time Since 2020. Pacific Gas & Electric (PG&E) offered 265,000 LCFS credits in their most recent late-August auction, marking the first reduction in auction volume since 2020. The utility offered a record volume of 289,000 LCFS credits at the end of May, ~20% more than the previous auction in March. PG&E generates credits by supplying low-carbon electricity for vehicle charging, and its quarterly offerings have climbed steadily from 72,000 credits in December 2020.
Market Update
- CARB reported an average California LCFS transfer price of $70.00/t in November 2023, down $6/t, or 7.9%, from October 2023. This marked the lowest monthly transfer price since October 2015.
- CARB reported 203 transfers in November 2023, a 55% decrease from the 451 transfers reported in October as activity slowed as is common for the final two months of the year. The total credit transfer volume reached 2,672,000 t, down 43% from the previous month, but marking a record volume for the month of November.
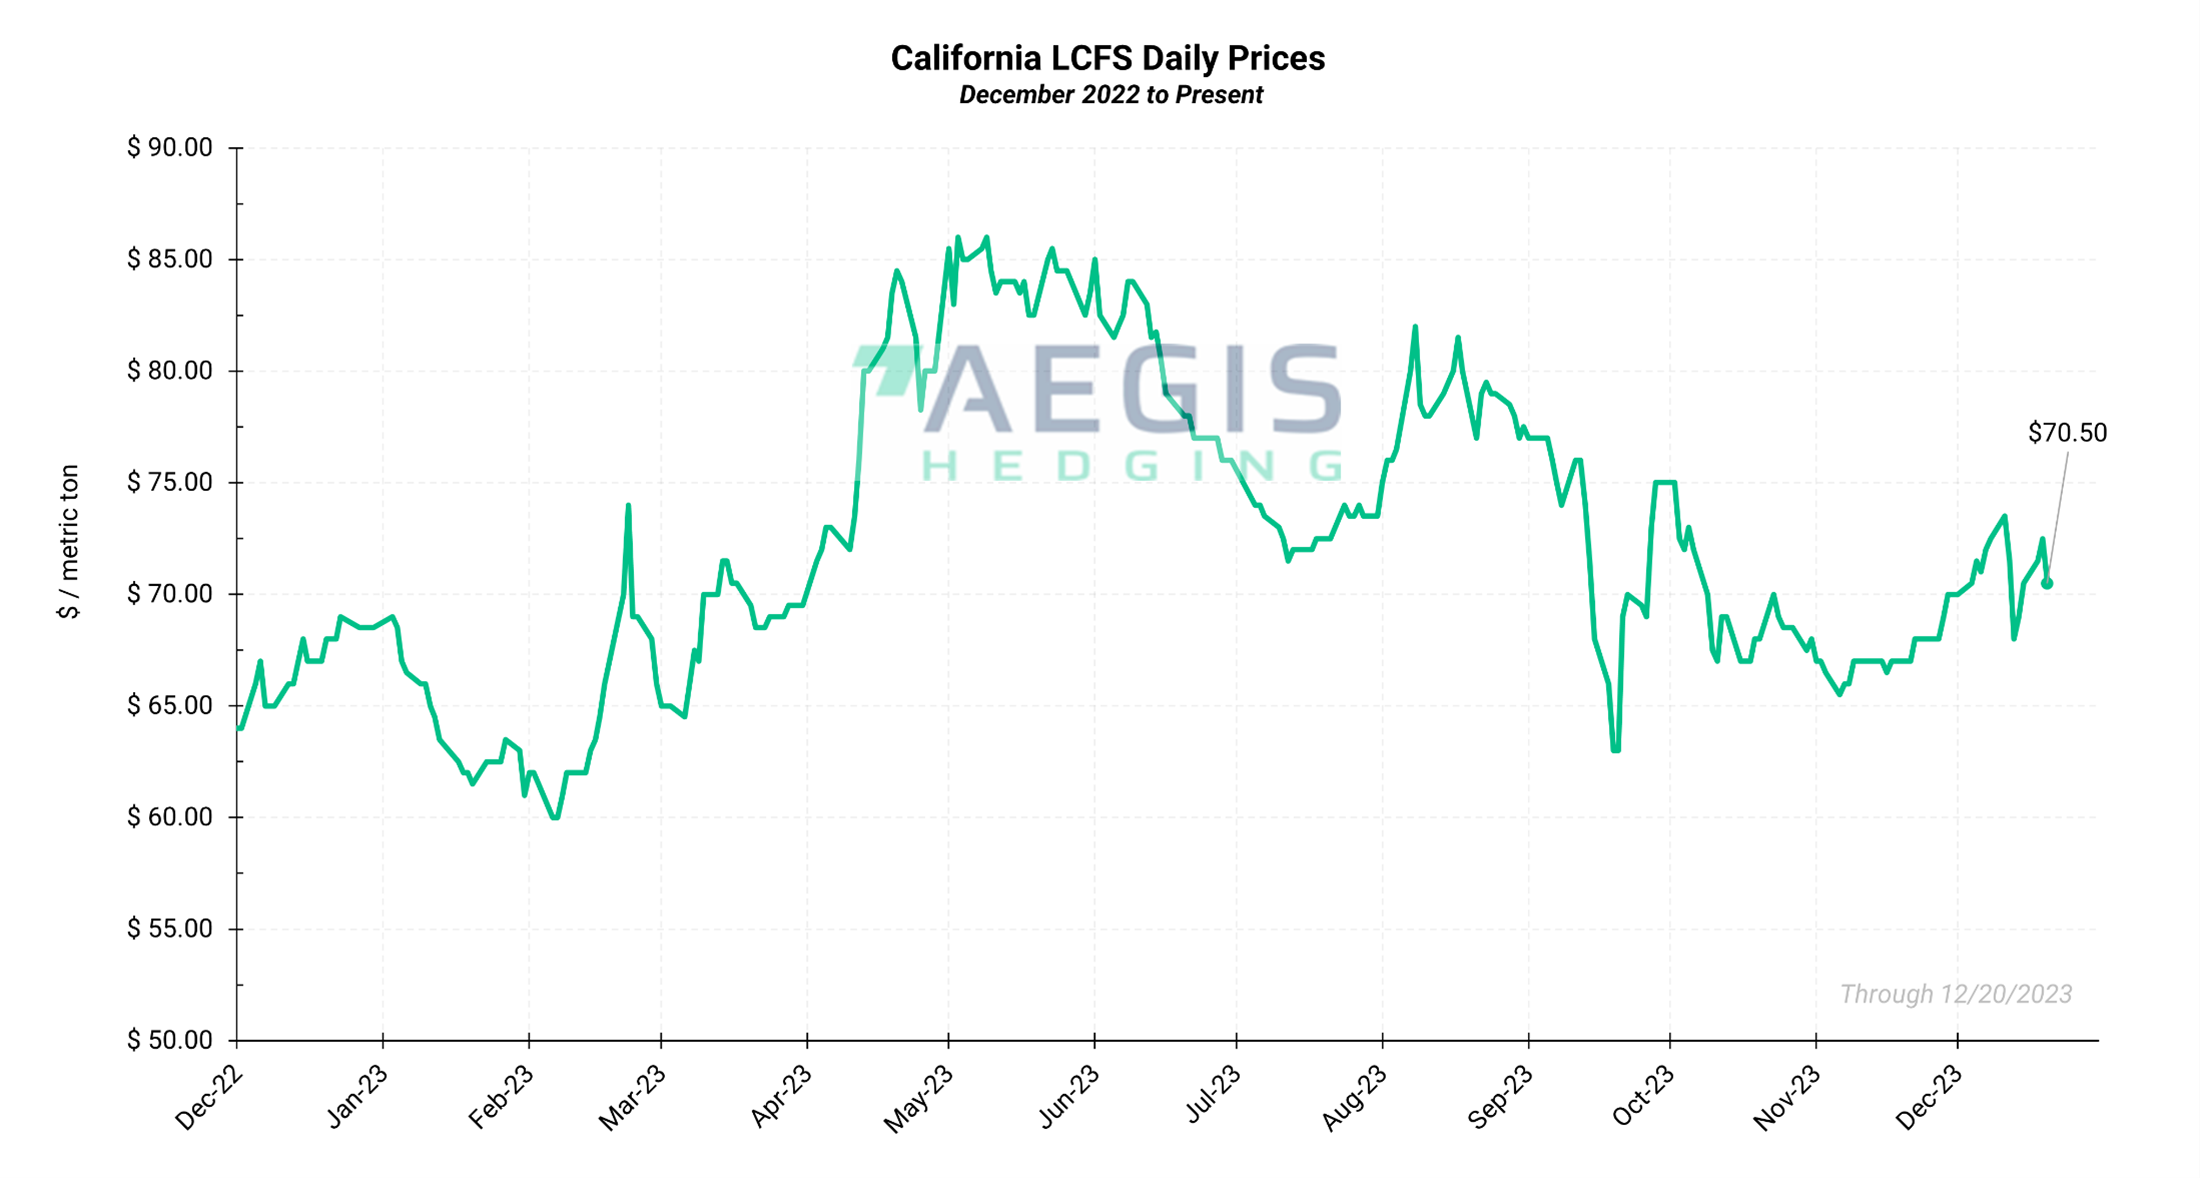
- California LCFS credits largely traded within the $66.00/t to $70.00/t band for the month of November as the market awaited the December release of proposed amendments to the LCFS. The market traded as high as $73.50/t in early December ahead of the CARB release, the highest level in over two months. Prompt credits retreated to $70.50/t following the release as the market had pinned hopes to a January or February board vote for the amendments.
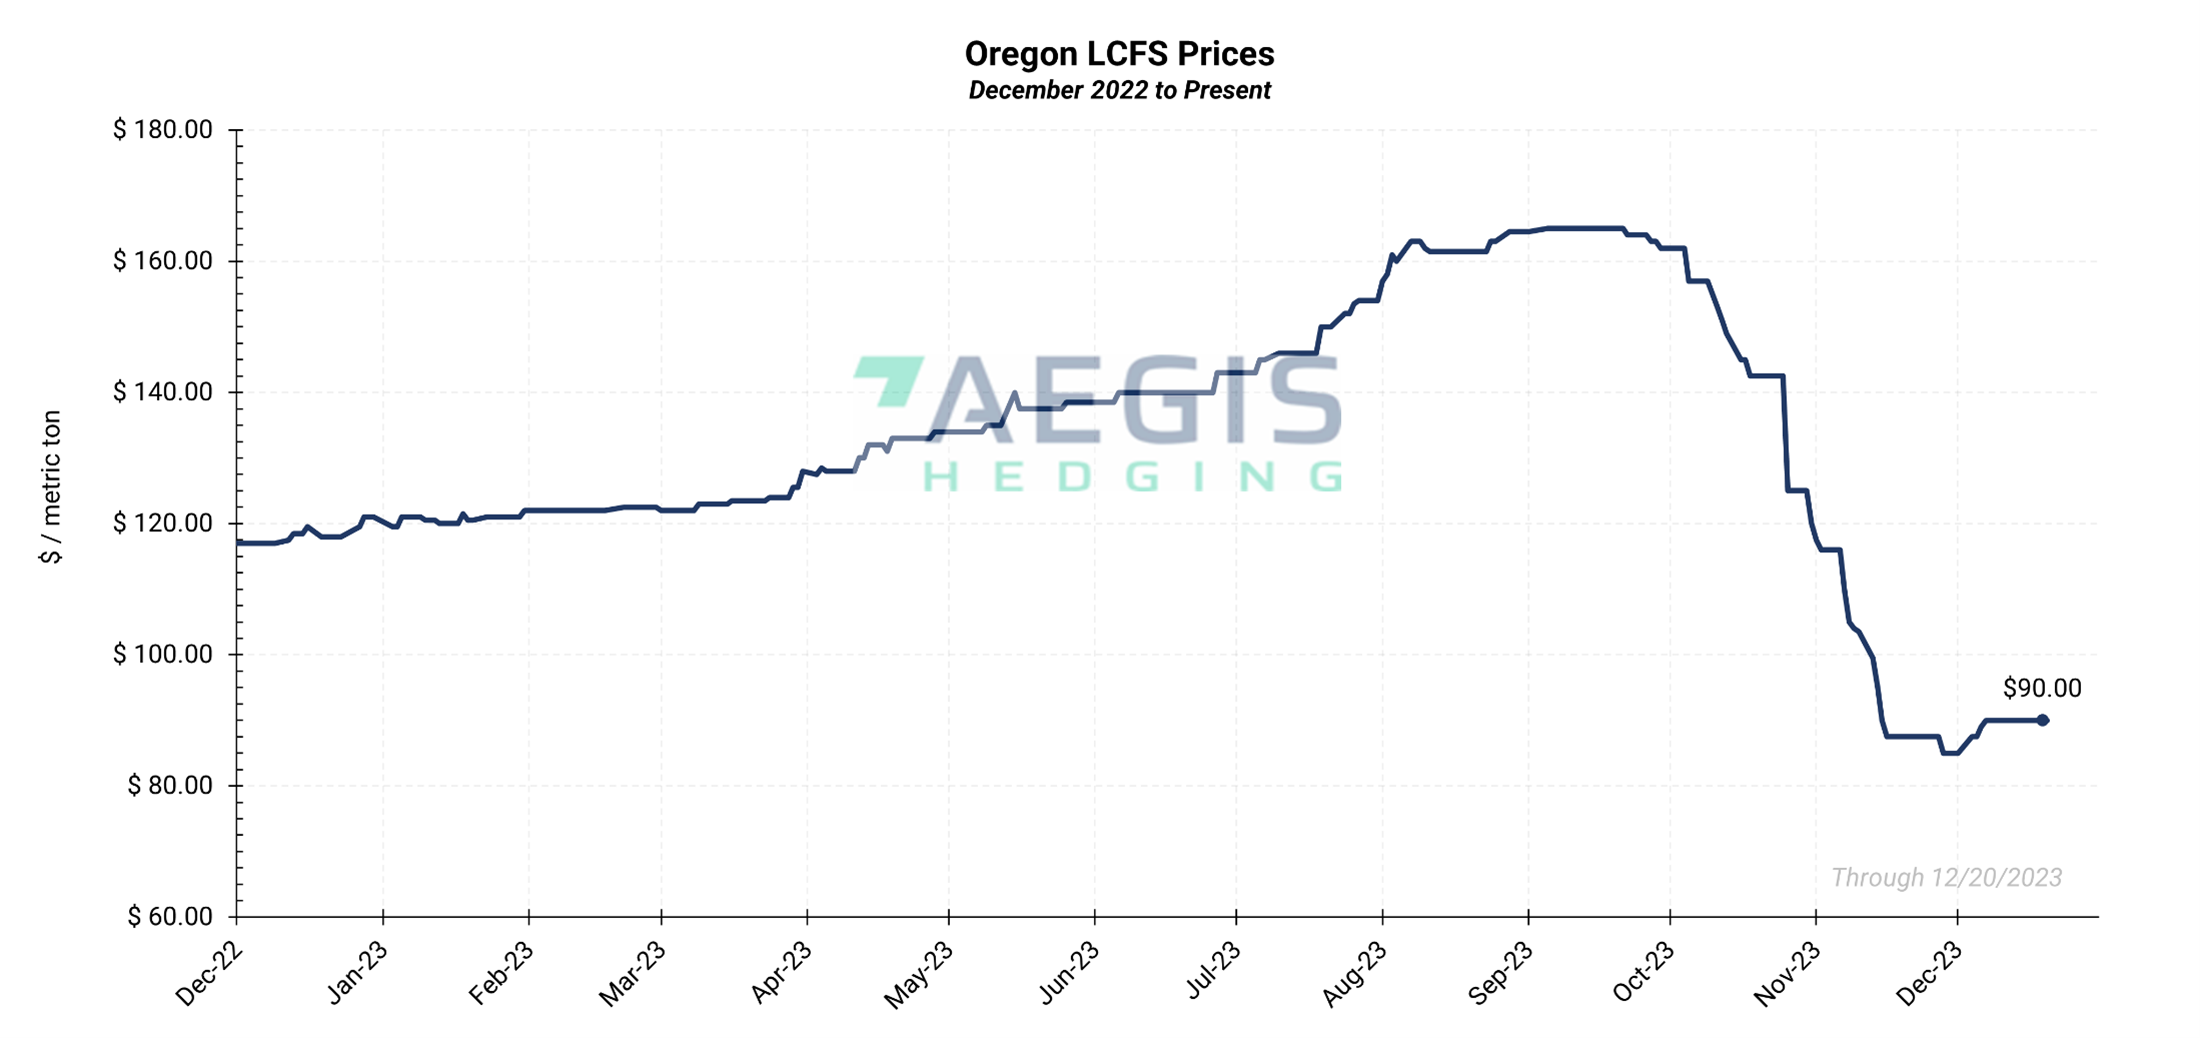
- Oregon DEQ reported a transfer volume of 188,537 metric tons in October 2023, up 84% from the previous month. October saw 34 transfers with an average transfer price of $143.93/credit, up by 1.4% from September’s $141.94. This marks the highest transfer price in more than three and half years.
- Oregon DEQ reported a transfer volume of 164,936 metric tons in November 2023, down 12.5% from the previous month. November saw 34 transfers with an average transfer price of $129.97/credit, down by 9.7% from October’s $143.93. This marks the lowest transfer price since April 2023 and comes just one month after the average transfer price reached the highest level in more than three and half years.
- Oregon LCFS credits continued to fall sharply over the course of November as the state’s higher credit prices attracted record volumes of renewable fuels. Prices tumbled $32.5/t, or 28%, over the course of November to end the month at $85.00/t, the lowest level in over five years. The losses built on a $42/t rout over the course of October. Prompt credit prices recovered to $90.00/t in December.
- Based on the most recent CARB calculations, the California LCFS maximum credit price is now $253.53/t. as of June 1, 2023, up from the 2022 maximum of $239.18/t. LCFS maximum credit prices are determined by a $200/t cap in 2016 dollars adjusted by a consumer price index.
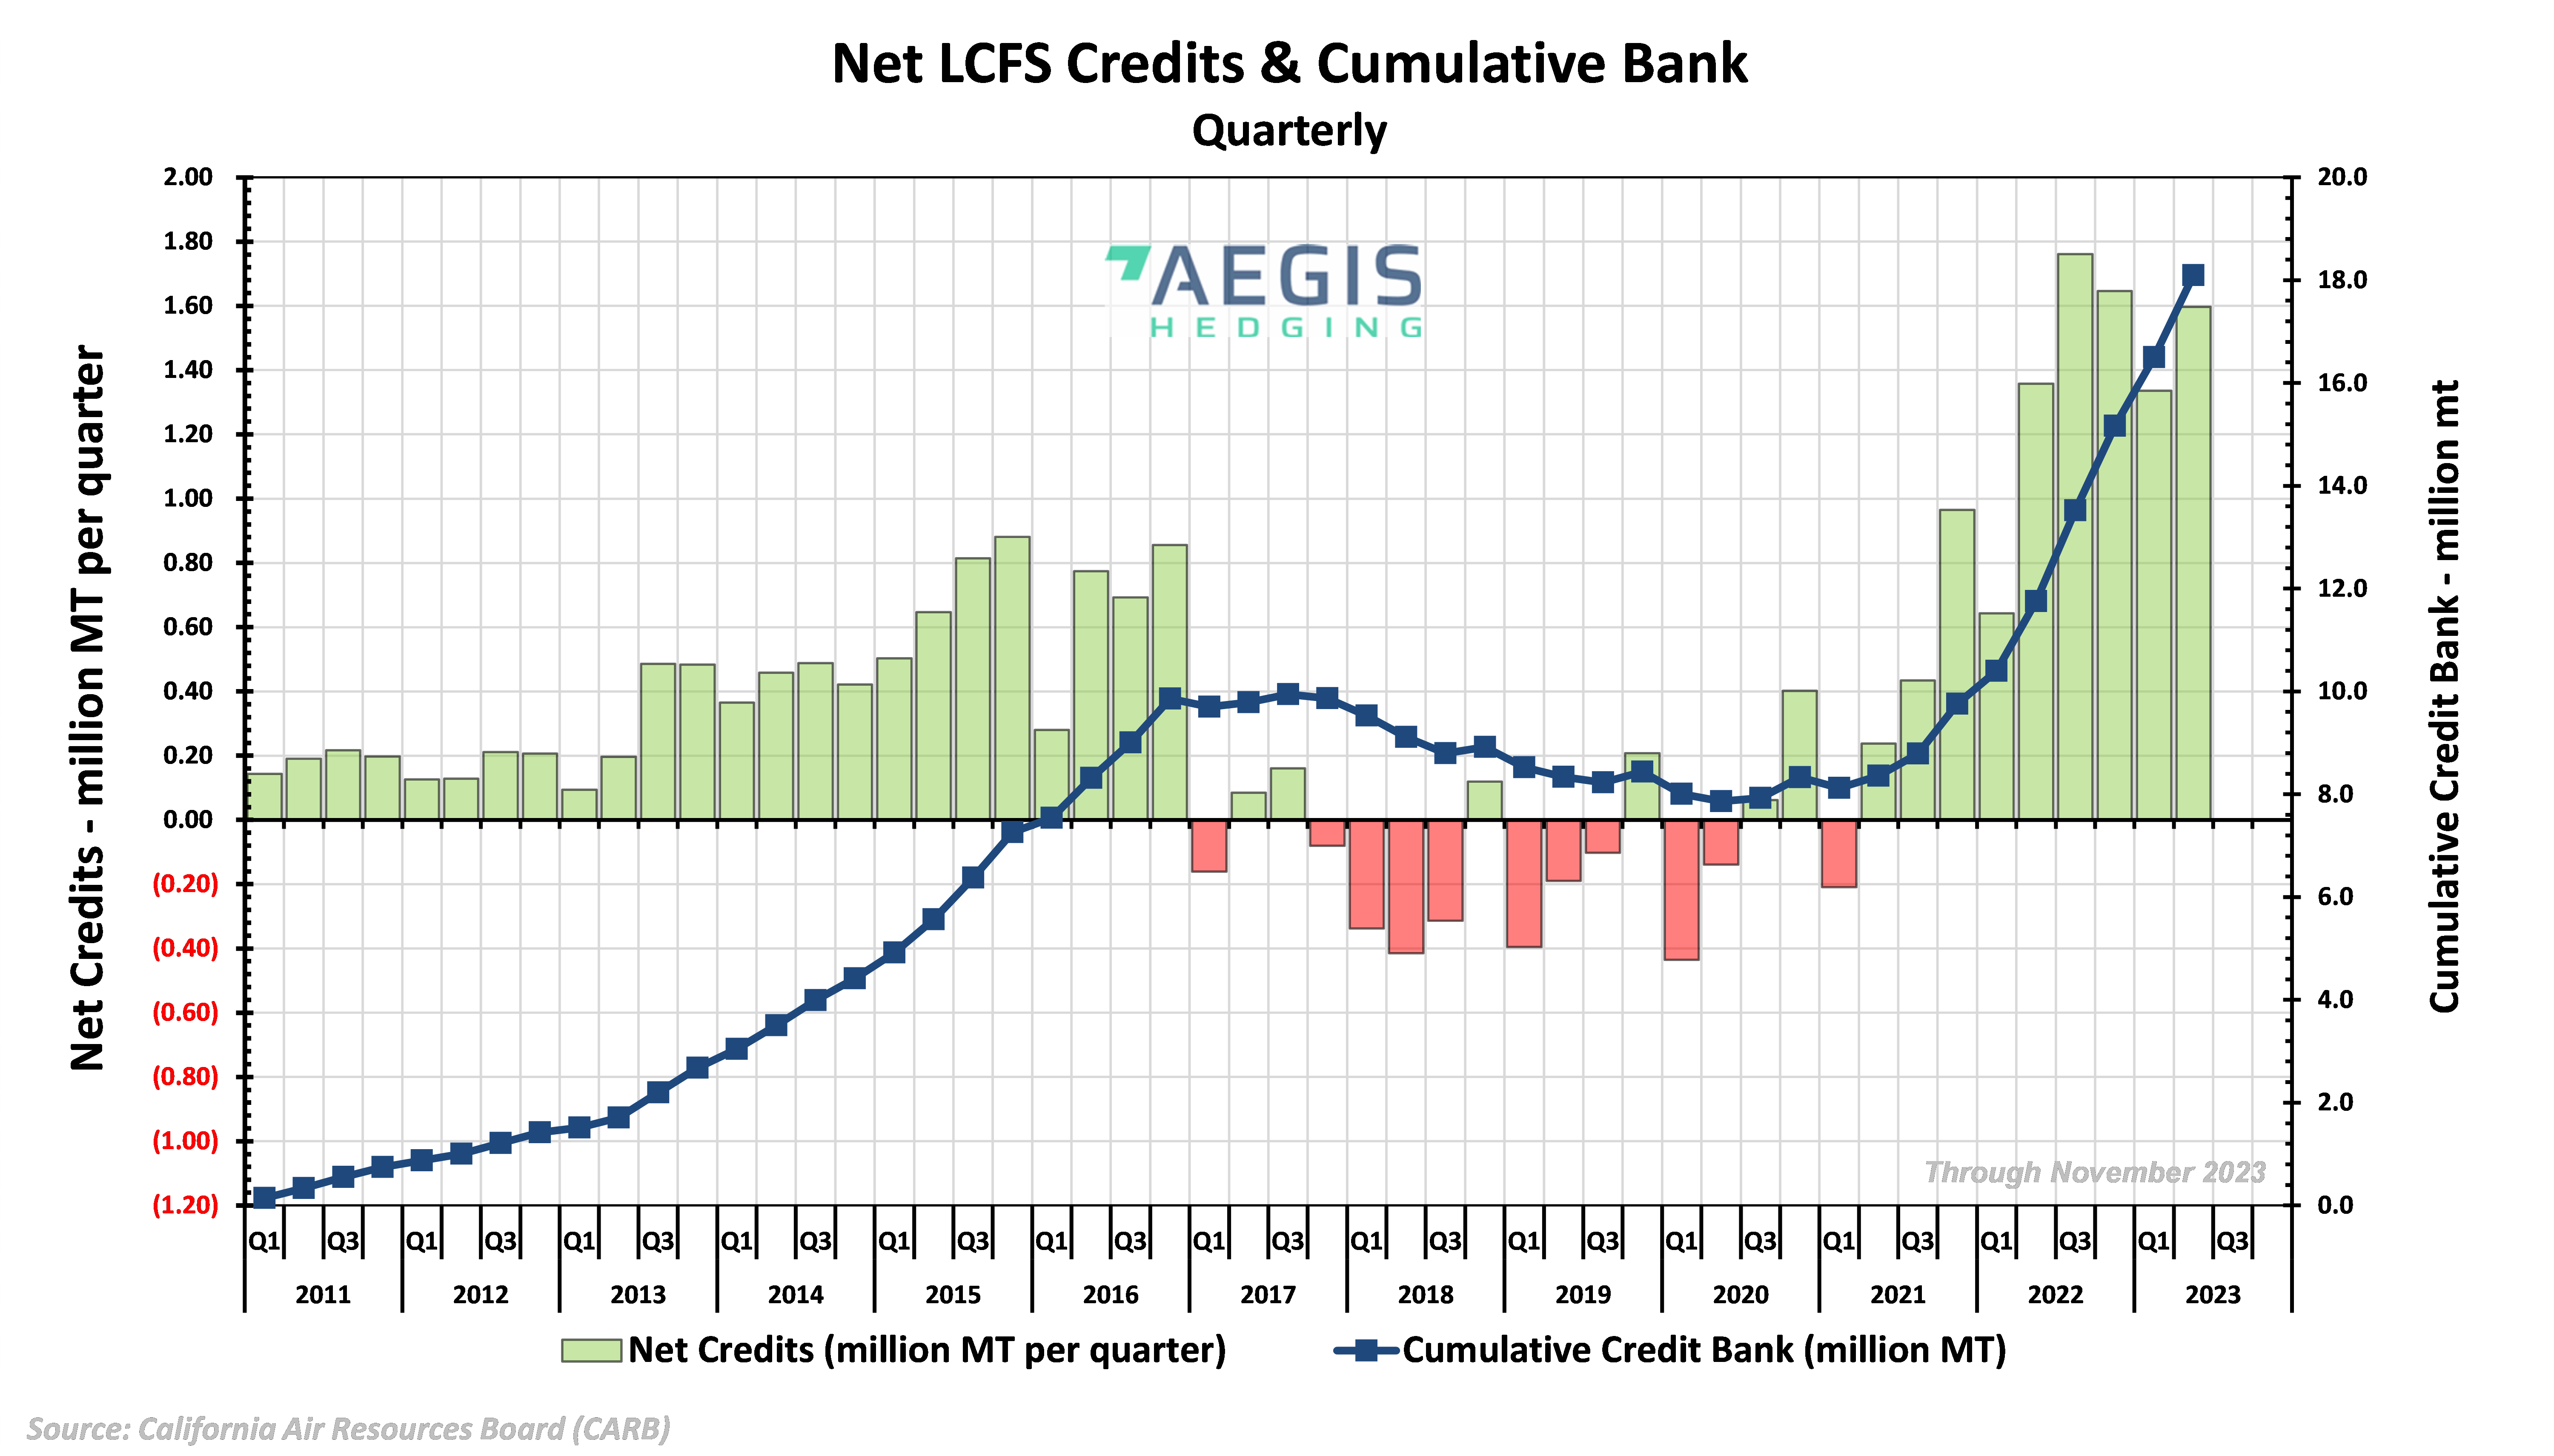
- The California LCFS market remains acutely oversupplied with the bank of available credits setting a fresh record high for the second quarter of 2023 and credits outpacing deficits by an increasing gap since July 2020. Oversupply saw prompt prices bottom at $59.00/t earlier this year, while the slow pace of regulatory reform looks poised to heavily pressure credits for the remainder of the year and early Q1 2024.
LCFS & CFP Schedule
| California LCFS Q3 2023 Reporting Deadline |
December 30th, 2023 |
|
|
|
|
|
|
|
| California LCFS Q3 2023 Data Release |
Janauary 31st, 2024 |
|
|
|
|
|
|
|
| California LCFS Q4 2023 Reporting Deadline |
April 1st, 2023 |
|
|
|
|
|
|
|
|
|
|
|
|
LCFS Credit & Futures Pricing
| Credit Prices as of December 20th, 2023: |
California Futures Prices as of December 20th, 2023: |
- California - Spot Delivery: $ 70.50
|
|
- Oregon - Spot Delivery: $ 90.00
|
|
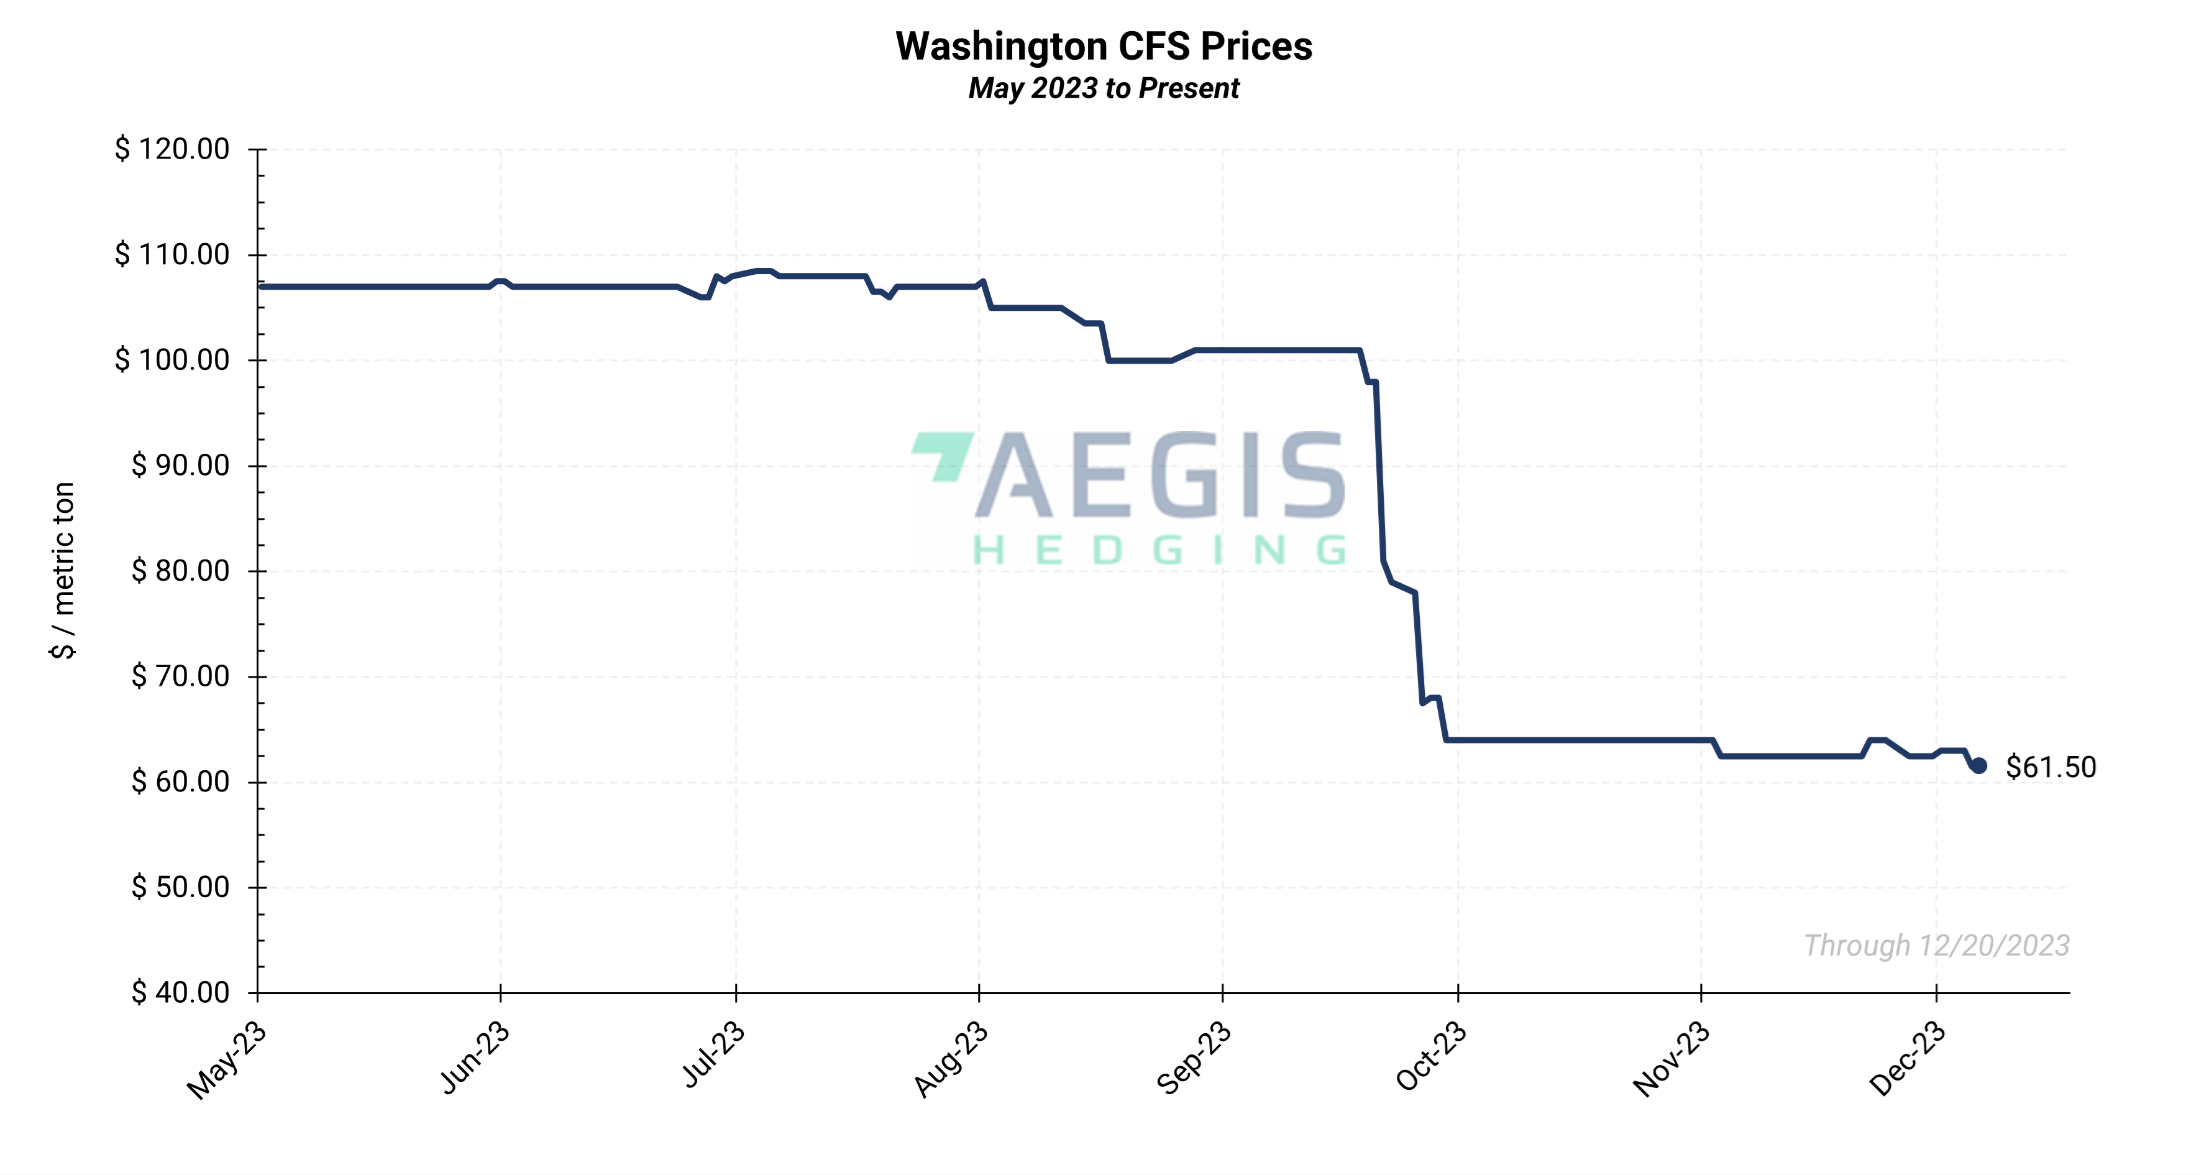
- Washington - Spot Delivery: $ 61.50
|
|
LCFS Cost for Gasoline and Diesel
|
California, as of December 20th, 2023:
|
Oregon, as of December 20th, 2023:
|
- CARBOB (No Cl ethanol) - Vintage 2023: 9.53 cents per gallon
|
- E10 gasoline - Vintage 2023: 6.80 cents per gallon
|
- CARBOB (79.9 Cl ethanol) - Vintage 2023: 9.05 cents per gallon
|
- B5 diesel – Vintage 2023: 7.75 cents per gallon
|
Monthly Credit Transfer Activity for California
|
Time
|
Transfers
|
Total Volume
|
Avg $/credit
|
|
23-Nov
|
203
|
2,672,000
|
$70
|
|
23-Oct
|
451
|
4,661,000
|
$76
|
|
23-Sep
|
233
|
1,033,000
|
$73
|
|
23-Aug
|
168
|
2,044,000
|
$77
|
|
23-Jul
|
417
|
4,347,000
|
$75
|
| 23-Jun |
222 |
2,470,000 |
$79 |
| 23-May |
158 |
1,684,000 |
$81 |
| 23-Apr |
547 |
5,596,000 |
$74 |
|
23-Mar
|
252
|
2,702,000
|
$73
|
|
23-Feb
|
161
|
1,293,000
|
$71
|
|
23-Jan
|
470
|
4,564,000
|
$81
|
|
22-Dec
|
292
|
3,001,000
|
$86
|
|
22-Nov
|
181
|
2,379,000
|
$81
|
|
CY 2022
|
3,137
|
30,641,000
|
$125
|
|
CY 2021
|
2,664
|
25,279,000
|
$187
|
|
CY 2020
|
2,461
|
21,728,000
|
$199
|
|
CY 2019
|
1,656
|
14,146,000
|
$192
|
|
CY 2018
|
1725
|
13,334,000
|
$160
|
|
CY 2017
|
1226
|
8,875,000
|
$89
|
|
CY 2016
|
929
|
5,343,000
|
$101
|
|
CY 2015
|
578
|
2,852,000
|
$62
|
|
CY 2014
|
304
|
1,667,000
|
$31
|
|
CY 2013
|
202
|
887,000
|
$55
|
Source: https://ww2.arb.ca.gov/resources/documents/monthly-lcfs-credit-transfer-activity-reports
Monthly Credit Transfer Activity for Oregon
|
Time
|
Transfers
|
Total Volume
|
Avg $/credit
|
| 23-Nov |
34 |
164,936 |
$129.97 |
| 23-Oct |
34 |
188,537 |
$143.93 |
| 23- Sep |
23 |
102,570 |
$141.94 |
| 23- Aug |
29 |
188,709 |
$137.33 |
| 23- Jul |
32 |
166,522 |
$137.93 |
| 23-Jun |
28 |
123,401 |
$130.21 |
| 23-May |
30 |
121,556 |
$131.04 |
|
23-Apr
|
69
|
322,461
|
$121.73
|
|
23-Mar
|
50
|
345,944
|
$118.85
|
|
23-Feb
|
24
|
130,929
|
$119.73
|
|
23-Jan
|
41
|
212,109
|
$116.98
|
|
22-Dec
|
47
|
329,116
|
$118.02
|
|
22-Nov
|
24
|
132,299
|
$117.80
|
|
CY 2022
|
319
|
1,607,127
|
$119.01
|
|
CY 2021
|
245
|
1,035,306
|
$125.30
|
|
CY 2020
|
151
|
806,028
|
$128.08
|
Source: https://www.oregon.gov/deq/ghgp/cfp/Pages/Monthly-Data.aspx
Monthly Credit Transfer Activity for Washington
|
Time
|
Transfers
|
Total Volume
|
Avg $/credit
|
| 23-Nov |
- |
- |
- |
| 23-Oct |
10 |
49,930 |
$98.12 |
| 23- Sep |
20 |
51,322 |
$96.26 |
| 23- Aug |
4 |
27,055 |
$106.66 |
| 23-Jul |
0 |
0 |
- |
|
CY 2022
|
-
|
-
|
-
|
|
CY 2021
|
-
|
-
|
-
|
|
CY 2020
|
-
|
-
|
-
|
Source: https://ecology.wa.gov/air-climate/reducing-greenhouse-gas-emissions/clean-fuel-standard/data-reports
Figure 1. California LCFS Prompt USD/mt December 2022 - Present
|
|
|
|
|
2022 Average Daily Price: $ 98.35
|
2023 Average Daily Price: $ 72.93
|
|
2022 Highest Daily Price: $ 153.50
|
2023 Highest Daily Price: $ 86.00
|
|
(January 6th, 2022)
|
(May 9th, 2023)
|
|
|
Figure 2. Oregon LCFS Prompt USD/mt December 2022 – Present
|
|
|
|
|
2022 Average Daily Price: $ 117.85
|
2023 Average Daily Price: $ 137.33
|
|
2022 Highest Daily Price: $ 126.50
|
2023 Highest Daily Price: $ 167.00
|
|
(February 17th, 2022)
|
(September 21st, 2023)
|
|
|
Figure 3. Washington CFS Prompt USD/mt May 2023 – Present
|
|
|
2023 Average Daily Price: $ 95.29
|
|
2023 Highest Daily Price: $ 111.00
|
|
(June 15th, 2023)
|
|
|
Figure 4. California LCFS Net Credits & Cumulative Bank Volume - Quarterly
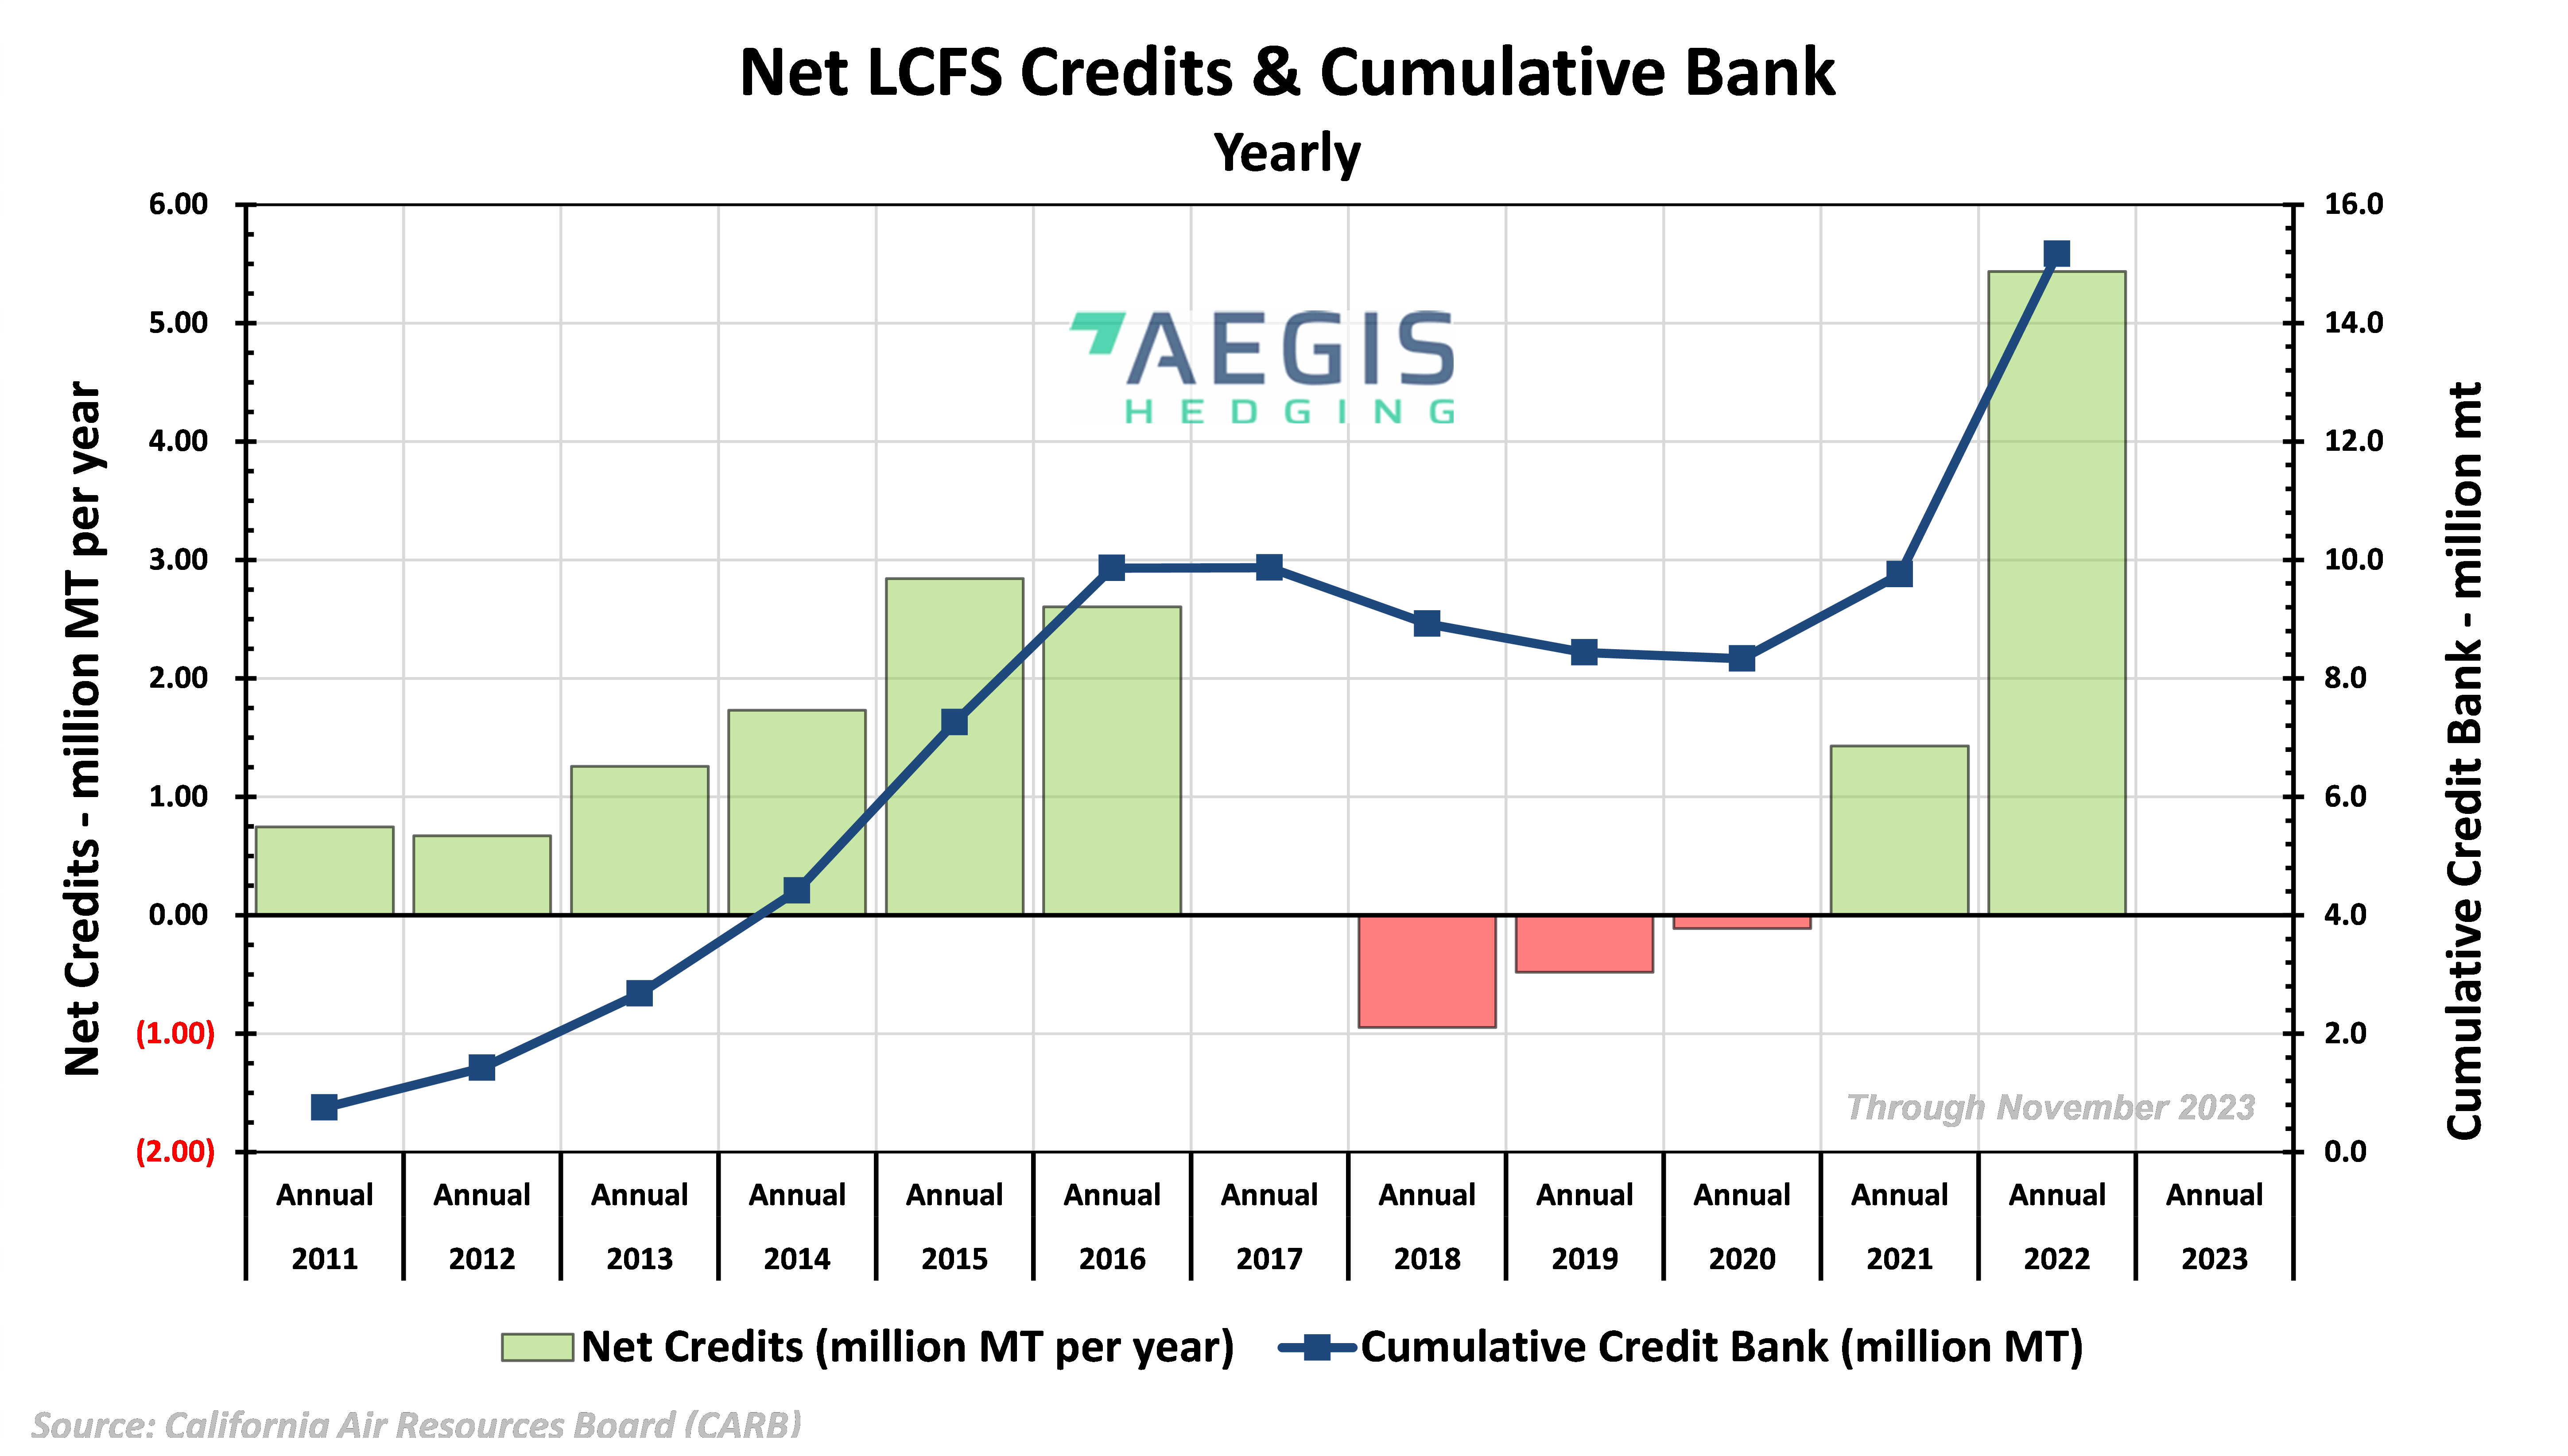
Figure 5. California LCFS Net Credits & Cumulative Bank Volume - Yearly
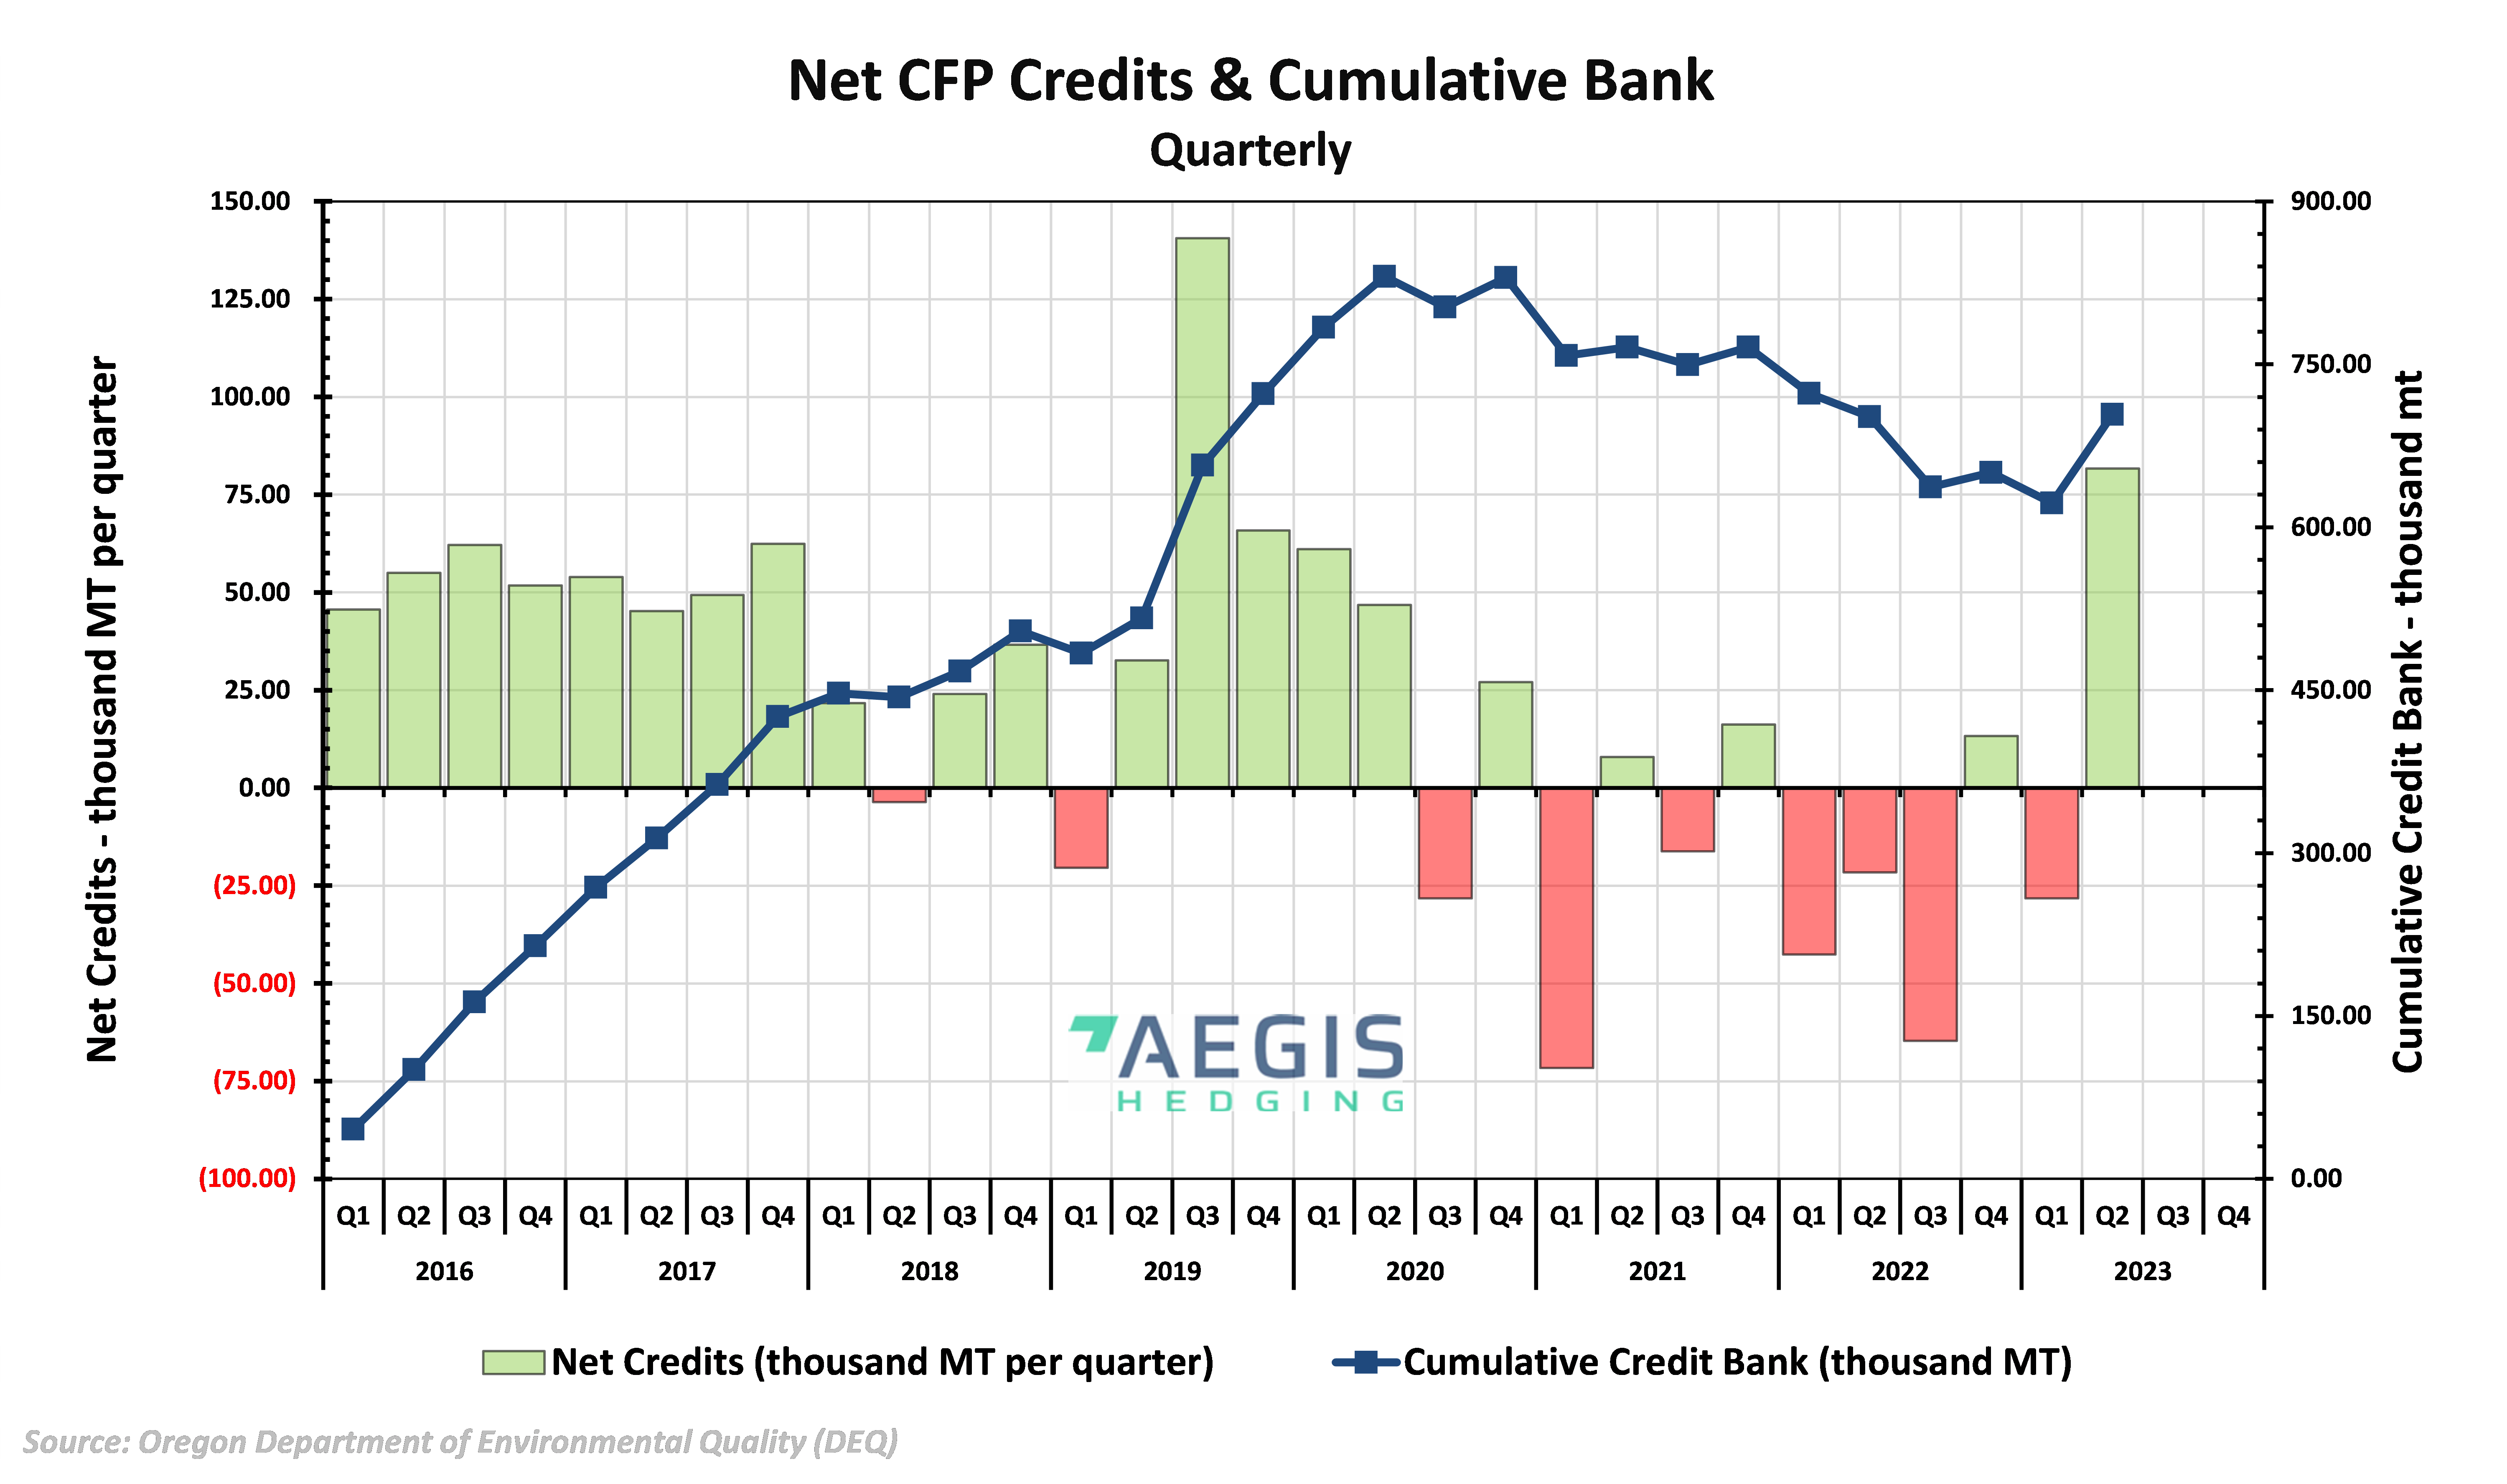
Figure 6. Oregon CFP Net Credits and Cumulative Bank Volume - Quarterly
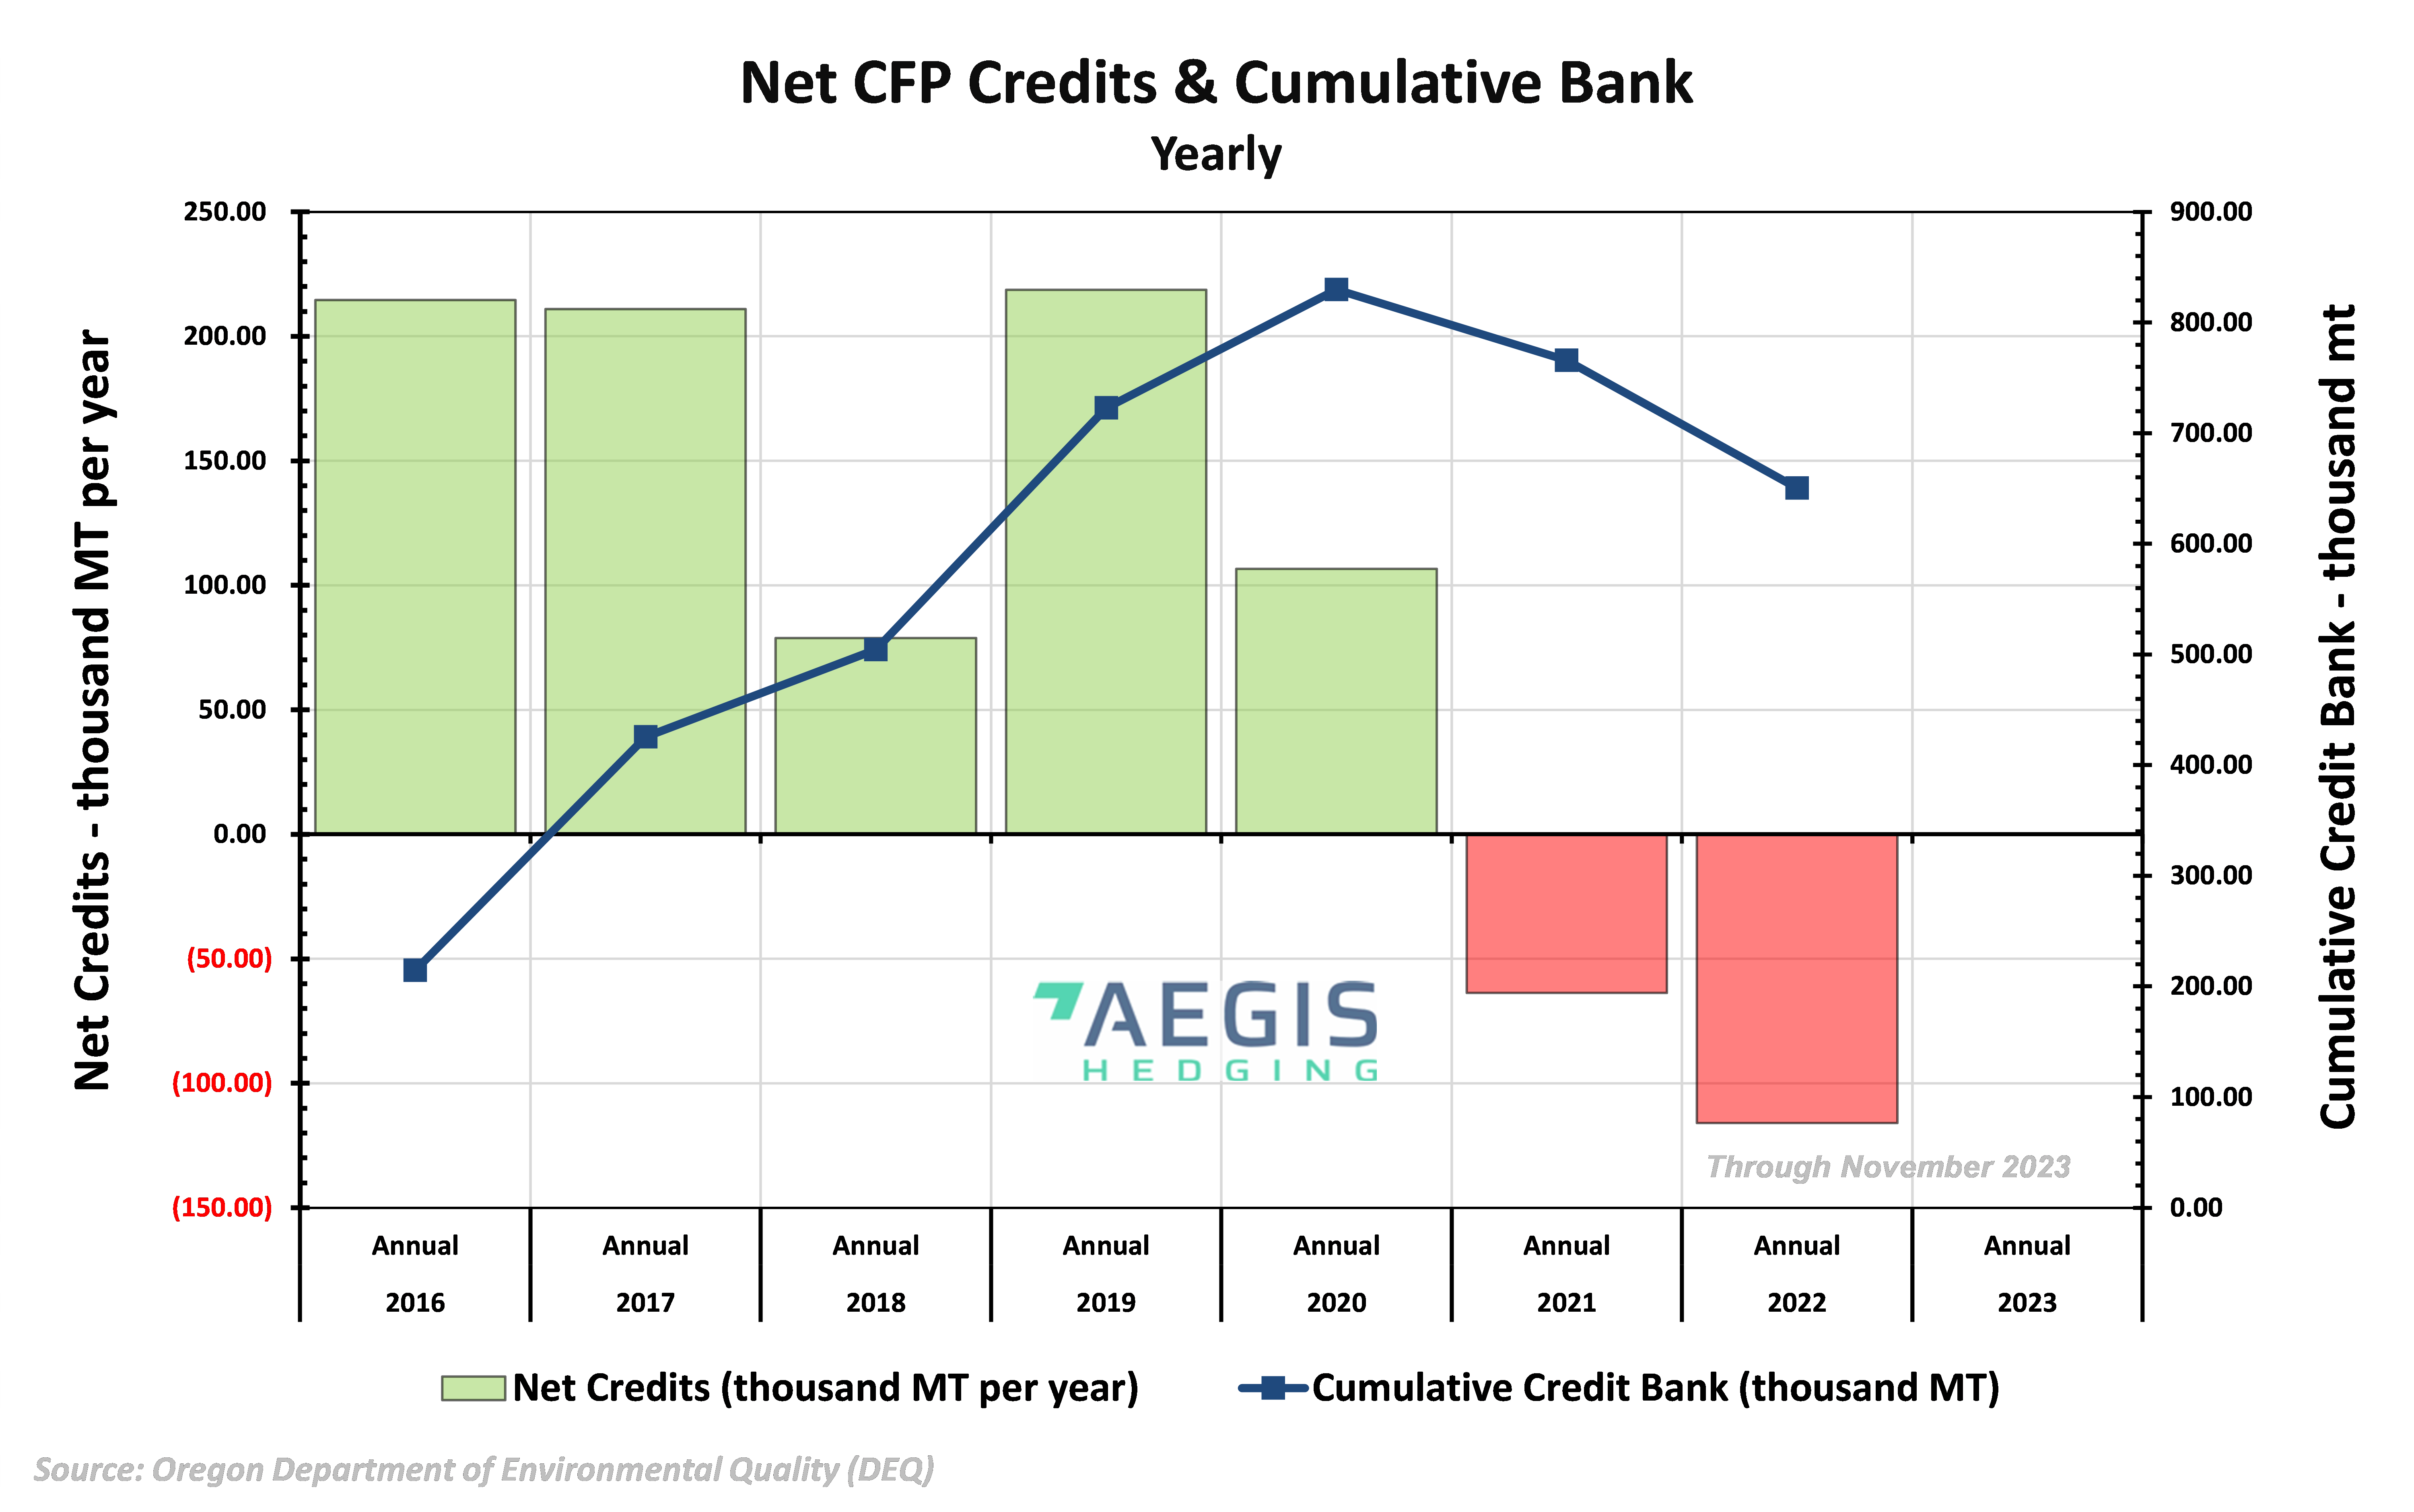
Figure 7. Oregon CFP Net Credits and Cumulative Bank Volume - Yearly
Questions? Contact our team for more information: environmental@aegis-hedging.com
CONFIDENTIAL – UNAUTHORIZED THIRD-PARTY DISTRIBUTION PROHIBITED