To quickly access the page content, please click on the links below:
News Update
-
Q1 2022 shows 892,431 MT net credit in LCFS bank. In the first quarter of 2022, California's Low Carbon Fuel standard (LCFS) credit bank reached a record high as RD usage, and electricity-based transportation fuel pathways continue to escalate. Q1 2022 shows 892,431 MT net credit in LCFS bank. CARB data posted on July 29th indicates that the first quarter's credits and deficits were 6.04 million and 5.15 million, respectively, which resulted in a surplus equal to 892,431 MT. Consequently, that was the second largest LCFS generation quarter, overtaken only by 973,100 MT created in the fourth quarter of 2021. Furthermore, it was the biggest California LCFS generation during Q1 in the last 11 years. LCFS credit bank grew by 9.4% and reached a record of 10.35 million tons. Therefore, credit prices for prompt delivery dropped by 3.8% and traded down to $88. That was a significant change from the last month's price range of $91.50 – $95.00. However, the values are still above the five-year low of $77.00. It is believed that LCFS credits surpluses will continue until CARB tightens carbon intensity (CI) benchmarks. Public comments are currently taken on 25% or 30% below 2010 levels reduction targets to strengthen LCFS CI benchmarks.
- California LCFS transfers reach a record high in July 2022. According to CARB data, there were 439 transfers of 3.68 mn metric tons of LCFS credits in July, a 73% increase in volume traded compared to the same period in 2021. Data included both spot transfers and forward deliveries. The lowest trade price recorded in July 2022 was $73/t, which is $5/t lower than the bottom price in June 2022.
- CARB schedules a workshop to discuss changes to the LCFS program. LCFS credit prices fluctuate due to the heavy increase in the credits bank. Consequently, regulators scheduled a workshop on August 18th, 2022, to discuss mandates that bring down transportation fuel carbon intensity (CI). Currently, LCFS inventory is at a record high as the supply of low-carbon fuel increases, and demand for CARBOB still hasn't reached pre COVID-19 level. Regulators discuss whether to limit LCFS generation sources like electric forklifts and crop-based fuels and enforce reductions for jet fuels used in intrastate flights. Moreover, CARB board members suggested that a decrease in credit prices proposes the possibility of a much higher level of investment and innovation. However, formal rulemaking for needed changes has not begun. The process of it might start only in early 2023 and likely will take a year.
- California gasoline demand drops. According to the latest state tax data, California has seen a decline in gasoline demand in April as retail fuel prices remained high. The state recorded fuel taxes on around 895,000 b/d of gasoline for the month, a 1% decrease from March and a 12% drop from April 2019 before the pandemic. The decline appeared after a month of constant gasoline retail price of $5/USG. The prices surged due to western sanctions on Russia after it invaded Ukraine, which affected global trade flow. California's average retail price increased to $6.3/USG in mid-June.
- Steady sales of California zero-emissions vehicle (ZEV) in Q2. According to state vehicle registration information, overall vehicle sales have decreased in Q2, however, ZEV sales remained steady. Around 80,000 ZEVs were sold, which made up almost 17% of the 477,000 total lightweight cars sold. In Q1, a number was similar as 81,000 ZEVs were sold, which was 16% of the total sales. California seeks to achieve 100% of all lightweight vehicles sold to be ZEVs by 2035. Regulators are taking comments on Advanced Clean Cars II, which suggest that 35% of new car sales should be zero-emission vehicles. However, automakers see the target as "extremely challenging”. In Q4 2021, vehicle charging generated 10% of all LCFS sourced.
- Marathon: feedstock limitation might be a benefit. Marathon Petroleum – an independent refiner and RD producer – believes that actions to limit the use of feedstock from soybeans, corn, or other food sources in renewable fuels could balance out RD profitability. Facility has used crop-based feedstock at its Dickinson RD plant in North Dakota, which has a capacity of 12,000 b/d. It could also use the material starting next year at their 16,000 b/d Martinez refinery in California. During the first quarter of 2022, 5.3% of newly generated LCFS was sourced from soybean oil. As LCFS bank is at all times high, credit prices have halved in the last year and traded below $90/ metric ton. Consequently, some sees the limitations as a necessary action.
- Washington is taking forward steps for the state's LCFS. Washington LCFS program is set for approval this fall. The state would seek a 20% decrease in CI levels from the 2017 number by 2034. Reductions would start lightly and increase significantly throughout the years – 0.5% by 2023, 1% by 2024, 10% by 2031, 20% by 2034, and 20% by 2038. Washington's program would cover LPG and propane used in transportation. However, jet fuel would be excluded. Liquid fuel producers and importers, gaseous fuel dispensers, and utilities supplying power to charge vehicles would start LCFS deficit and credit generation. All regulated fuels brought and stored in Washington on January 1st and after would be a subject of the regulation. The current proposed rule does not consider credit generation from refinery investments, as well as a suggestion to dedicate up to half of the residential electric vehicle charging credits to auto producers. The public comment period will continue to August 31st. The vote for rule approval is planned for late November.
- Oregon CFP credit transfers rebounded. According to the Oregon Department of Environmental Quality, credit transfer volume in the Oregon Clean Fuel Program rose in July as prices sank. Last month, participants reported moving over 90,000 metric tons of credits across 23 transfers. This increased from the 70,000 t of credits moved in the same period the previous year. The price ranged between $121/t at the beginning of July and $108/t at the end of it. However, activity rebounded from the June levels, the lowest month in the program's history.
- Comments in favor of tightening LCFS targets in Oregon. On July 19th, during the short public hearing session, most participants supported the idea of the tighter LCFS targets. Department of Environmental Quality's proposed Clean Fuels Program extension where Oregon would aim for a 20% reduction in CI target by 2030 and a 37% decrease by 2035. The new proposal exceeds a 25% target for 2035, which was approved in 2020. Moreover, the extension includes updated explanations on electric, hydrogen, ocean-going, and airport equipment sources credit generation. Department sought commission approval of the changes in September and committed to reviewing the progress of meeting the targets in 2029.
- The legality of Oregon's new fuel goals. Newly proposed clean fuel targets caused petroleum producers and suppliers to question their legitimacy. The Western States Petroleum Association (WSPA) released a comment that included a legal analysis on DEQ authority to exceed the target approved by the governor's 2020 executive order and criteria approved by the initial legislation, which firstly approved the program. Furthermore, such a development might violate the state's constitution and the federal Commerce Clause. However, the majority of comments fully supported the proposal.
Schedule
- September 20, 2022: California LCFS 2Q 2022 reporting deadline
- October 31, 2022: California LCFS 2Q 2022 data release
- January 2, 2023: California LCFS 3Q 2022 reporting deadline
- January 31, 2023: California LCFS 3Q 2022 data release
LCFS Credit Pricing
Credits Prices as of August 16th, 2022:
-
-
- California - Spot Delivery $90.00
- Oregon - Spot Delivery $108.00
LCFS Credit Transfer Activity for California
|
Time
|
Transfers
|
Total Volume
|
Avg $/credit
|
|
Jul-22
|
439
|
3,680,000
|
$117
|
|
Jun-22
|
133
|
1,268,000
|
$113
|
|
22-May
|
119
|
861,000
|
$125
|
|
22-Apr
|
468
|
4,584,000
|
$153
|
|
22-Mar
|
280
|
3,301,000
|
$158
|
|
22-Feb
|
159
|
1,550,000
|
$163
|
|
22-Jan
|
358
|
3,389,000
|
$167
|
|
21-Dec
|
269
|
3,217,000
|
$172
|
|
21-Nov
|
128
|
1,125,000
|
$174
|
|
21-Oct
|
434
|
3,782,000
|
$182
|
|
21-Sep
|
136
|
1,518,000
|
$183
|
|
21-Aug
|
100
|
709,000
|
$185
|
|
21-Jul
|
252
|
2,125,000
|
$188
|
|
21-Jun
|
190
|
1,873,000
|
$190
|
|
21-May
|
81
|
791,000
|
$190
|
|
21-Apr
|
345
|
3,455,000
|
$192
|
|
21-Mar
|
307
|
3,490,000
|
$198
|
|
21-Feb
|
87
|
1,019,000
|
$197
|
|
21-Jan
|
335
|
2,176,000
|
$199
|
|
20-Dec
|
260
|
2,997,000
|
$199
|
|
20-Nov
|
133
|
1,207,000
|
$196
|
|
20-Oct
|
336
|
2,237,000
|
$198
|
|
20-Sep
|
167
|
1,553,000
|
$196
|
|
20-Aug
|
111
|
857,000
|
$196
|
|
20-Jul
|
334
|
2,509,000
|
$199
|
|
20-Jun
|
129
|
1,059,000
|
$202
|
|
20-May
|
90
|
470,000
|
$195
|
|
20-Apr
|
344
|
4,098,000
|
$198
|
|
20-Mar
|
233
|
2,312,000
|
$199
|
|
20-Feb
|
84
|
581,000
|
$206
|
|
20-Jan
|
240
|
1,895,000
|
$200
|
|
19-Dec
|
217
|
2,216,000
|
$197
|
|
19-Nov
|
88
|
705,000
|
$195
|
|
19-Oct
|
243
|
1,990,000
|
$195
|
|
19-Sep
|
137
|
1,179,000
|
$195
|
|
19-Aug
|
89
|
929,000
|
$194
|
|
19-Jul
|
188
|
1,574,000
|
$193
|
|
19-Jun
|
114
|
875,000
|
$190
|
|
19-May
|
76
|
408,000
|
$185
|
|
19-Apr
|
131
|
1,299,000
|
$180
|
|
Q1 2019
|
373
|
2,972,000
|
$188
|
|
CY 2018
|
1725
|
13,334,000
|
$160
|
|
CY 2017
|
1226
|
8,875,000
|
$89
|
|
CY 2016
|
929
|
5,343,000
|
$101
|
|
CY 2015
|
578
|
2,852,000
|
$62
|
|
CY 2014
|
304
|
1,667,000
|
$31
|
|
CY 2013
|
202
|
887,000
|
$55
|
|
CY 2012
|
24
|
164,000
|
$17
|
Source: https://ww2.arb.ca.gov/resources/documents/monthly-lcfs-credit-transfer-activity-reports
LCFS Cost for Gasoline and Diesel
Costs as of August 16th, 2022, for Vintage 2022:
-
- California
- Carbob (No Cl ethanol)- Vintage 2022 11.02 cents per USG
- Carbob (79.9 Cl ethanol)- Vintage 2022 10.31 cents per USG
- Oregon
- E10 gasoline- Vintage 2022 6.28 cents per USG
- B5 diesel – Vintage 2022 7.14 cents per USG
Market Update
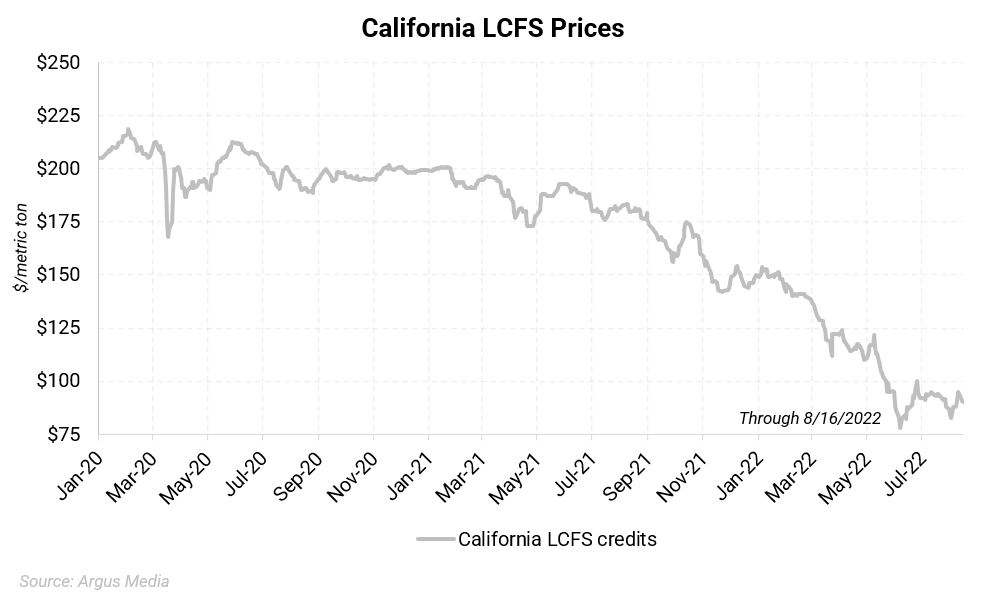
Figure 1. California LCFS USD/mt Jan. 2020 - Present
 |
| |
2021 Average Daily Price: $176.53 2022 Average Daily Price: $114.94
2021 Highest Daily Price: $201.00 2022 Highest Daily Price: $153.50 (1/6/2022) |
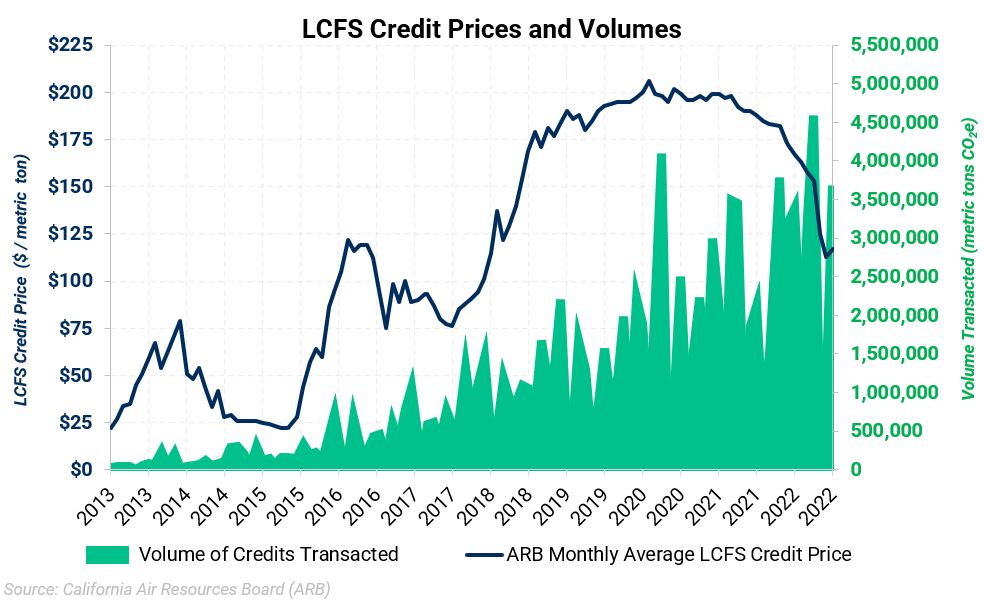
Figure 2. California Monthly LCFS Credit Price and Transaction Volume as Reported by ARB
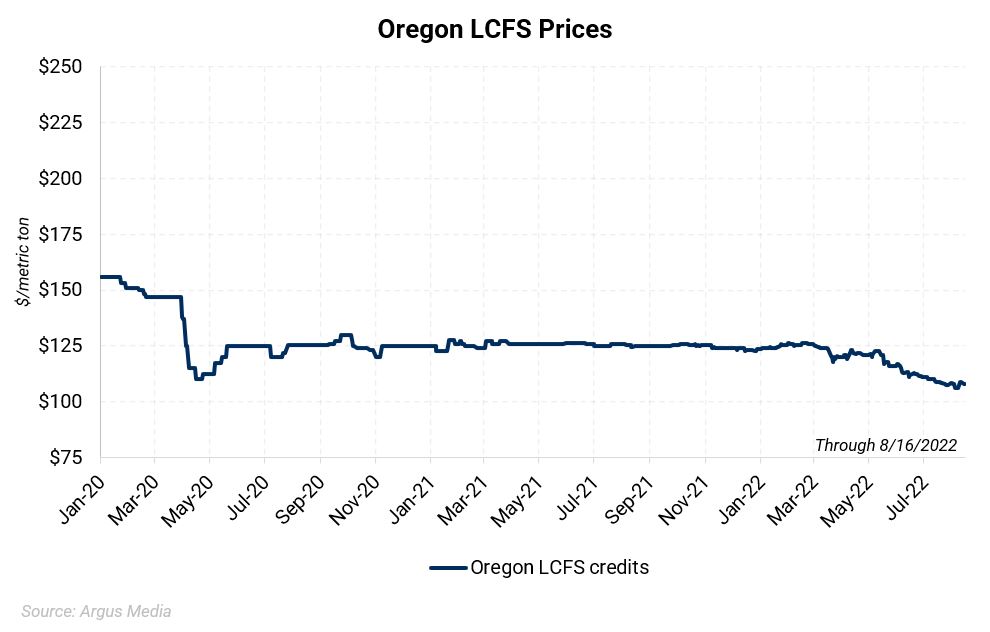
Figure 3. Oregon LCFS USD/mt Jan. 2019 – Present
|
|
|
|
|
2021 Average Daily Price: $125.32
|
2022 Average Daily Price: $118.57
|
|
2021 Highest Daily Price: $127.50
|
2022 Highest Daily Price: $126.50
|
Questions? Contact our team for more information: environmental@aegis-hedging.com
CONFIDENTIAL – UNAUTHORIZED THIRD-PARTY DISTRIBUTION PROHIBITED