Latest Insight
Last Look: Oil snaps its two-week losing streak, finishing $1.63 higher this week
The California Low Carbon Fuel Standard (LCFS) has increasingly become a victim of its own success. The state’s LCFS credit incentive draws the lowest carbon fuels into the state for consumption, displacing higher carbon fuels and generating an increasing number of credits against a declining volume of deficits. Credits have vastly outpaced deficits for two years, resulting in a record bank of cumulative credits at over 16.5 million. The structural oversupply has weighed on credit pricing, eroding the value of the incentive to renewable fuel producers. Credits reached the lowest levels in over six years at $59/t in February of 2023.
To address mounting oversupply, the California Air Resources Board (CARB) has undertaken a state-required Scoping Plan examining stricter carbon reduction targets of 30% and 35% compared to a 2010 baseline, increasing off the current target of 20%. A public workshop held by CARB on August 16 covered the implementation of its California Transportation Supply Model (CATS). The optimization model was used to simulate supply and demand of the California transportation fuel market. Materials provided by CARB laid out inputs used in the model and, perhaps more importantly, indicated what was not factored into current modeling efforts. CARB’s latest CATS model explores a 30% reduction scenario with a sizeable 5.00% step-down reduction taking place in 2025.
Below, we explore four LCFS scenario models AEGIS Hedging’s Emissions Advisory Team developed. The models are consistent in the timing for the rebalancing of the LCFS credit market while providing a range of cumulative credit bank estimates to guide stakeholders in likely developments as the LCFS program rulemaking goes into effect.
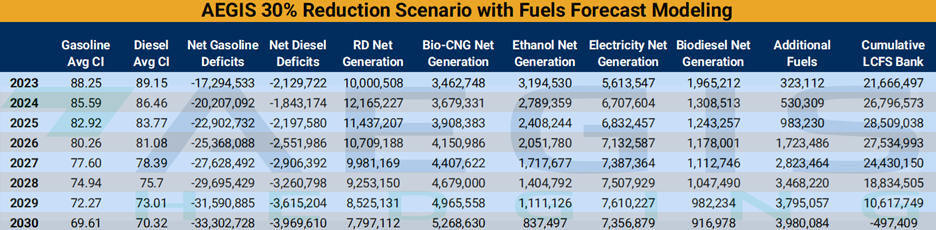
The first model examines a 30% carbon reduction target using AEGIS LCFS benchmark assessments and fuel forecasts. The model includes independent fuel assessments and assumes decreasing gasoline and ethanol demand and increasing diesel and renewable diesel demand.
The model runs the prevailing CI score for each fuel and thus does not account for improvements in carbon intensity. We adopted conservative growth estimates for renewable diesel given limitations in first-generation feedstock supply in addition to the increasing competitiveness of regional LCFS programs as well as Canada.
Under this model, the LCFS credit bank grows heavily through 2025 before falling progressively faster. The cumulative LCFS credit bank would not fall below current levels until 2029. While this model shows the cumulative bank drawing by 2030, we believe this to be an improbable outcome given the factors we were unable to build into the model. Due to a lack of sufficient data, we were unable to account for improvements in CI scores, alcohol-to-jet, and carbon capture and storage (CCS). CARB itself could not account for the latter two in its latest CATS model, as will be examined.
Using history as a reference, a direct linear increase in carbon intensity scores cannot be assumed as various market factors influence an industry’s performance beyond responsiveness to LCFS credit pricing. Lastly, AEGIS did not include jet fuel as an obligated fuel in its model, given the likely legal challenges CARB will face in implementing state-based jet fuel regulations. The addition of jet fuel to the model would contribute roughly 1.7 million deficits per year, likely starting in 2025.
We believe our model is directionally correct yet understates potential credit generation for the reasons outlined above. Any fuel optimization model is a simplification of a very complex system. Here, AEGIS has gone to great lengths to forecast all contributing fuels comprising the entire LCFS program yet could not account for the unknown impact of novel technologies that may or may not develop. Extending the simplification of the model over a seven-year forecasting effort understandably leads to slippage.
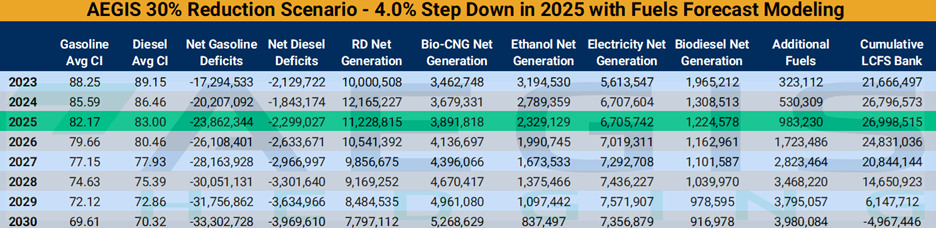
After reviewing the results, AEGIS determined that delayed implementation of CARB’s Scoping Plan would most likely require a step-down in 2025. CARB’s current timeline is to have an item ready for voting in early 2024, for implementation in 2024 (non-retroactive) or early 2025. After reviewing the impacts of various step-downs, we determined a reduction of at least 4.0% was warranted to begin balancing the market.
The model was re-run with the same inputs for a 30% reduction by 2030 with a 4.0% step-down in 2025. The step-down essentially freezes the LCFS bank in 2025, after which larger drawdowns are seen in the following years through 2030.
Under this scenario, the bank would fall under current levels by 2028, a full year earlier, with the potential for a draw in 2030. We again point out that our model understates credit generation as it does not account for improvements in carbon intensity, alcohol to jet, and CCS pathways.
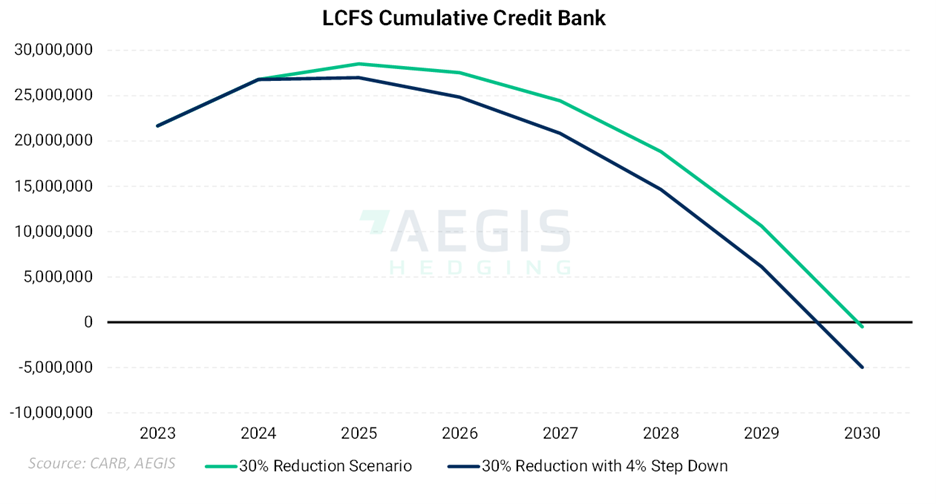
The impact of both scenarios on available LCFS credits is outlined below. Directionally, it is clear that 2025 will be a crucial inflection point for the program, with substantial rebalancing of the credit surplus taking place through 2030 and beyond. Declining carbon intensity scores and adopting new pathways and technologies will slow the draw rate, likely keeping the bank out of negative territory.
On August 16, CARB held a public workshop providing materials on the inputs used in its latest CATS scenario. The scenario plays out a 30% reduction in carbon emissions by 2030 with a 5.00% step-down in 2025.
The fresh inputs included total gasoline, diesel, CNG, jet demand, available SAF supply, and production and production limits for a wide range of fuels. CARB used vehicle miles traveled (VMT) and fleet assumptions to back into gasoline and diesel demand. CARB’s gasoline demand was slightly lower than the previous March scenario. The results were surprisingly close to AEGIS’ 4.00% step-down model.
Diesel demand was sharply reduced, reflecting significant assumptions about electrification and hydrogen penetration among the heavy-duty and medium-duty vehicle fleet (HDV) & (MDV). This resulted in fewer diesel deficits across the model, an outsized impact of renewable diesel credit generation, and a sharply higher electricity credit generation, particularly in 2023 and 2024.
When the model was run, AEGIS found that net credit generation for 2023 was much larger than existing data would deem possible. We believe the impact of this trend is overstated in the initial years by backing into fuel demand based on fleet and VMT assumptions and not recalibrating this approach with real-world fuel demand.
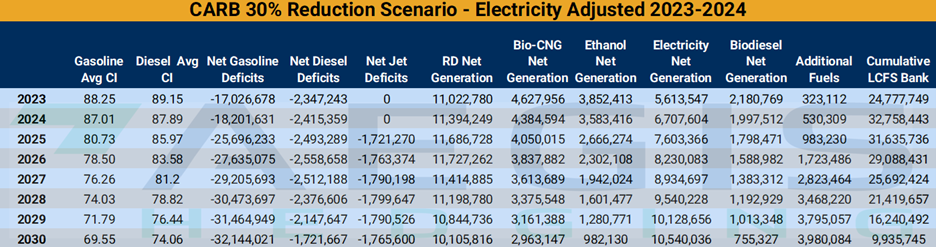
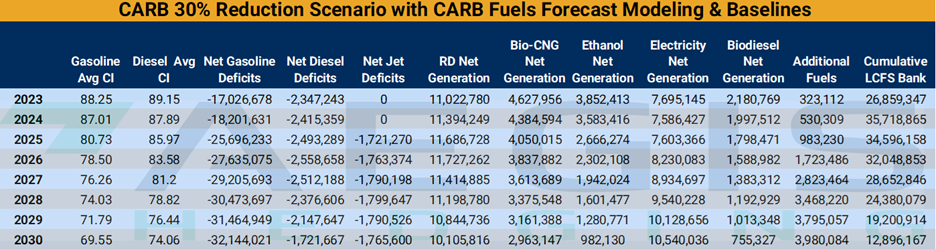
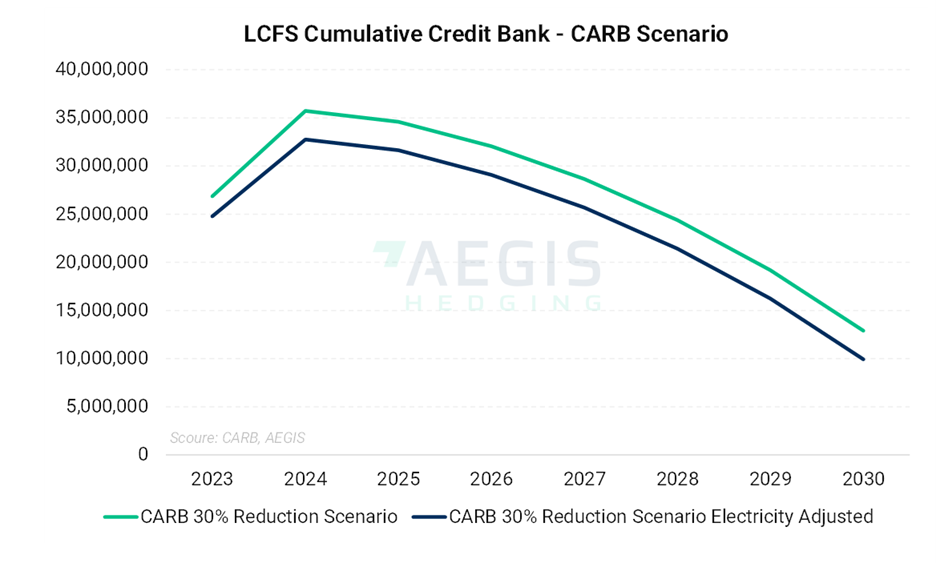
We re-ran the model including AEGIS electricity generation for 2023-2024 and reverted to CARB assumptions from 2025 onward. This provided more realistic cumulative credit generation for the 2023-2024 period, while the 2025 step-down showed similar results to the AEGIS 4.00% step-down model.
The CARB inputs resulted in more renewable diesel and bio-CNG credit generation on top of the material growth in electricity generation. Both CARB scenarios show bank drawdowns beginning in 2025 with the pace accelerating, while higher generation across several categories prevents the bank from going negative over the next seven years.
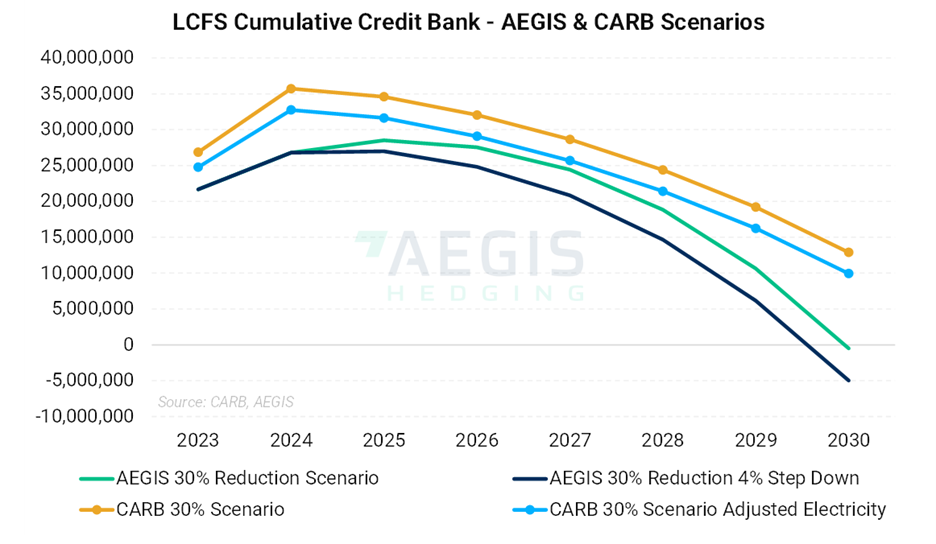
An AEGIS analysis of the credit bank/deficit ratio to LCFS credit pricing found that a credit bank of roughly 8.8 million credits or less will drive LCFS prices higher. In contrast, a bank over this level is more likely to pressure LCFS credit prices. The average of the 2030 ending bank across the four models examined is just over 4 million credits, implying LCFS prices should be supported to the upside as a CARB 30% reduction target plan is implemented.
Modeling an entire states’ fuel supply and demand curve for nearly a decade is an imperfect task. Estimating the growth and adoption of new technologies is a Sisyphean effort to model, while changing market conditions such as the introduction and expiration of other environmental credits and the opening or closing of arbitrage flows make for material unknowns.
CARB’s workshop materials provided a wealth of inputs, yet perhaps more importantly, the public comment period clarified what exactly was not accounted for in CARB’s latest CATS modeling effort.
CARB was unable to account for the alcohol-to-jet pathway due to a lack of sufficient data. CARB did not model the impact of CCS across the program. The board only updated the CI score for E85 ethanol rather than modeling more highly adopted blends like E10 and E15 (current ethanol blending in the state is around 12%). CARB also used the available national supply for most fuels without accounting for the parasitic demand from regional LCFS programs or Canada’s CFR.
Lastly, and most importantly, by backing into demand using fleet and VMT data, it is likely that CARB overstated the initial impact of electricity and hydrogen adoption in 2023 and 2024, while concurrently understating diesel demand. Estimates for HDV electric demand were roughly double the previous March estimates, while HDV hydrogen demand estimates were approximately triple. The same assumptions cut heavily into diesel demand which further impacted renewable diesel and biodiesel demand forecasts.
Moving forward, CARB plans to release a rulemaking with a 45-day review period following a September board meeting. This regulation will be voted on at a board meeting in early 2024. CARB aims to put this regulation into effect in 2024.
AEGIS modeling has demonstrated that 2025 will be a key inflection point for the program, with a 4-5% or greater step-down required to begin balancing the market. We have found that the 2030 ending balance for the credit bank could end up in the 4-9 million range, with levels under the 8.8 million credit level likely to support higher pricing.